[PowerShell Script] Displaying the Call Stack for Inner and Hidden Exceptions
This script automates a technique I’ve been using for a long time whenever I need to see the stack for exceptions hidden in a call stack and if you are like me, you prefer to use an automated approach rather than a manual approach.
I’m not going to write the technique here because Mike Stall has already done it. It’s here.
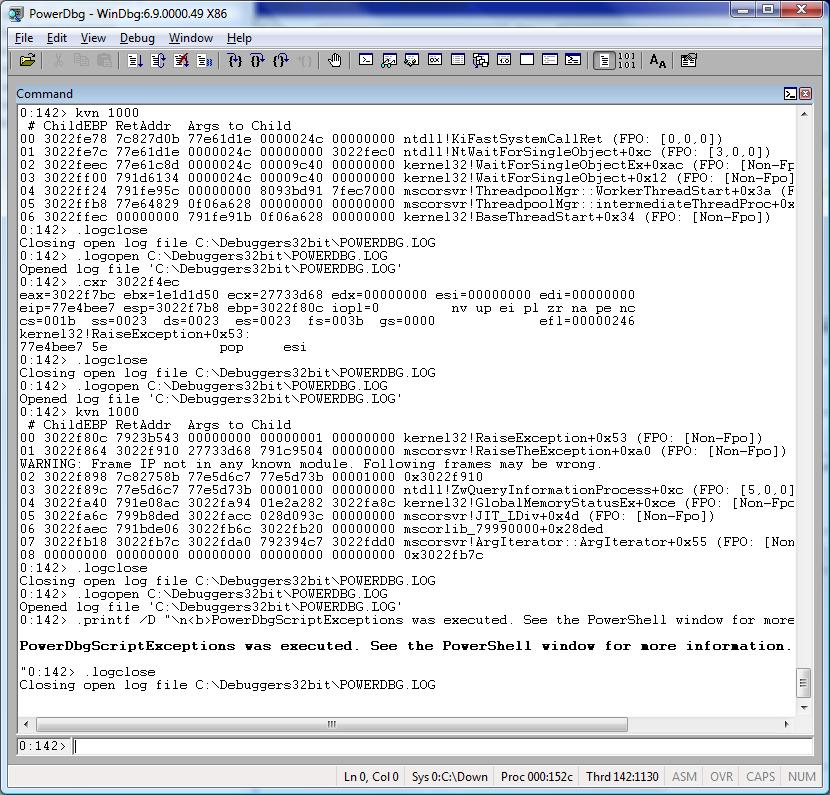
With this script you’ll get not only the threads handling exceptions, but any call stack for exceptions that may have happened before.
There are several situations in which you may find this script useful, for example:
TYPICAL SCENARIO
The application is hung up. You attach the debugger to it or get a dump file and debug it. You see threads waiting for a Critical Section. You see the thread that has the Critical Section lock, and it is normal and waiting for work. At this point you wonder what’s going on, and why the lock was not released before.
RESOLUTION
To solve the mystery, you get the exceptions from the thread that has the lock and find out a handled exception that happened before and the corresponding call stack. At this point you have a strong hypothesis: maybe the method handling the exception didn’t release the lock. For example, the finally block may not have the code to release the Critical Section; therefore the Critical Section leaks, freezing the application.
Attention! Before running this script, make sure you are using the latest version of the PowerDbg library, then do this:
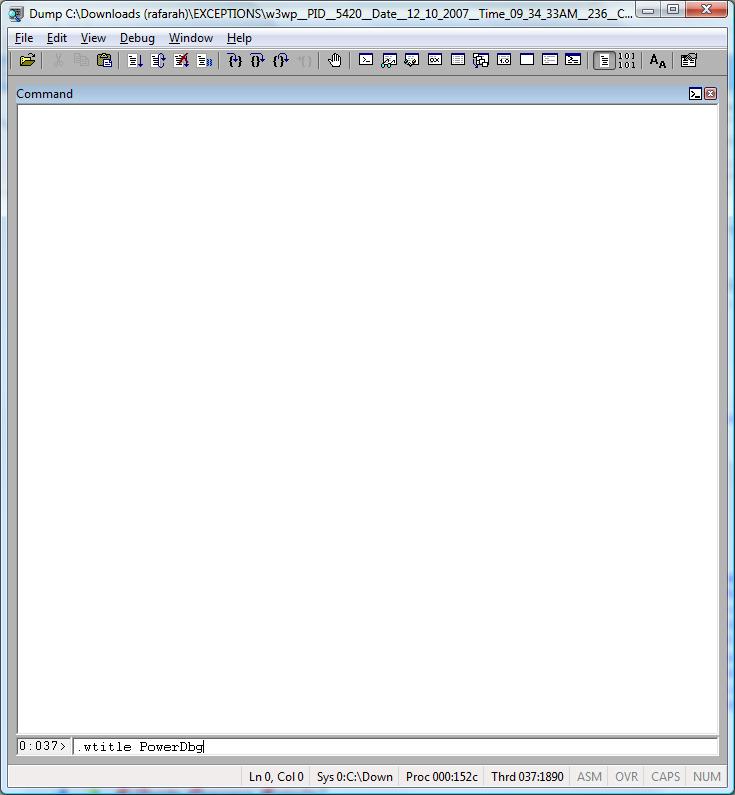
a) Change the WinDbg title using: .wtitle PowerDbg
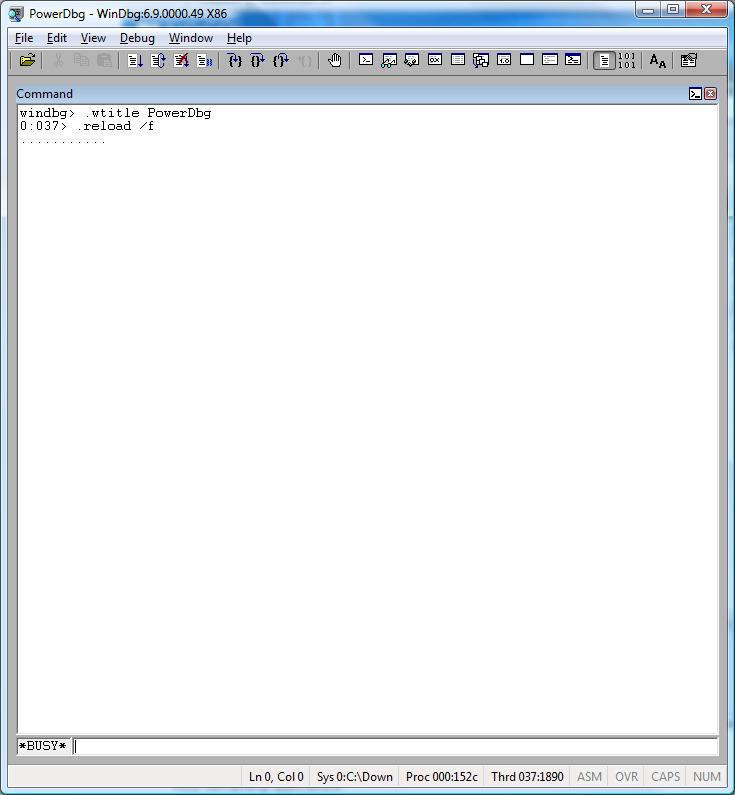
b) Load all symbols: .reload /f
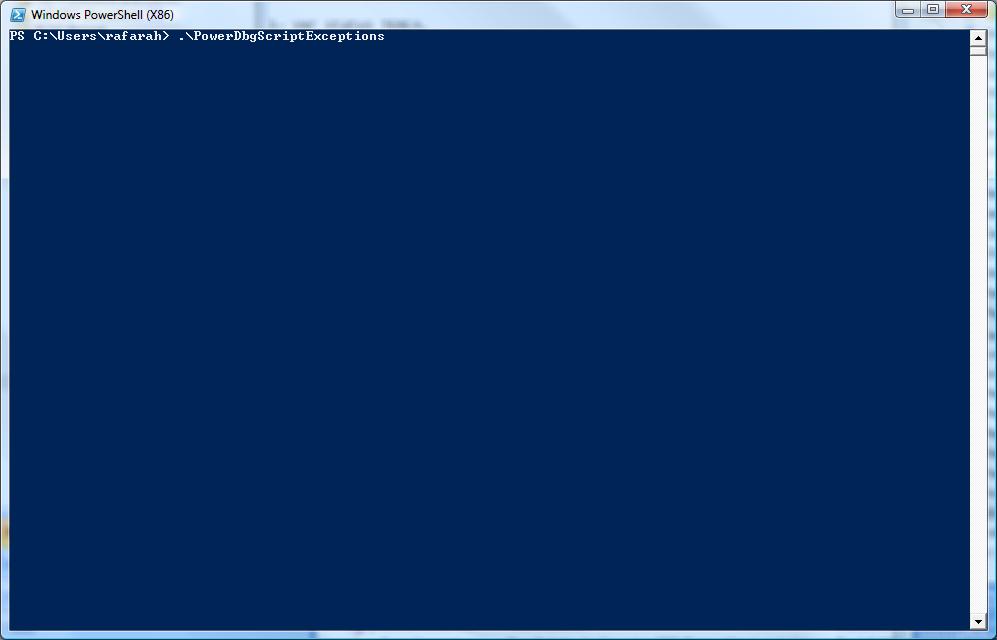
These are the screenshots:
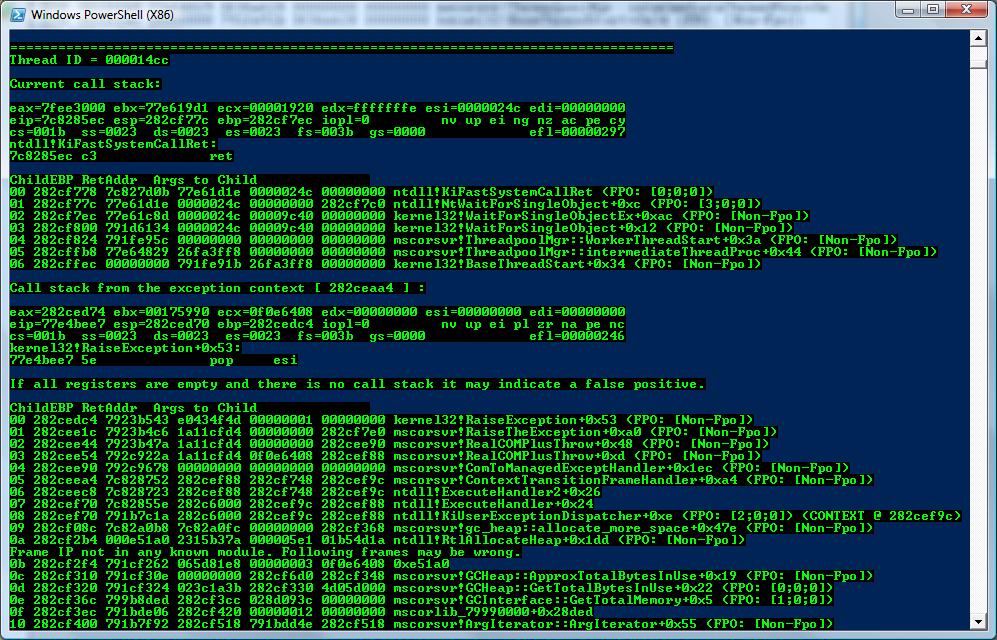
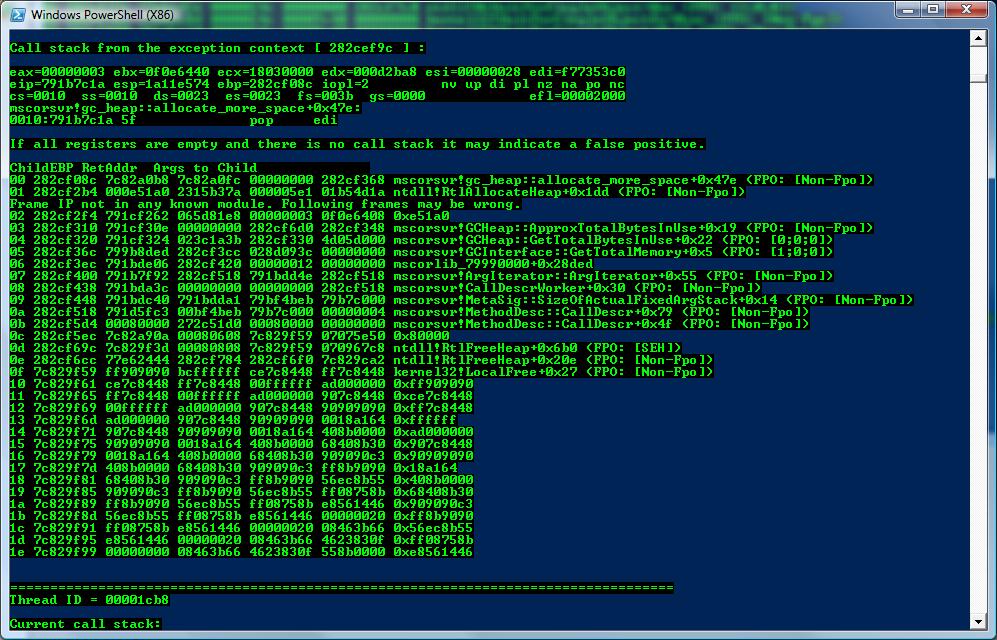
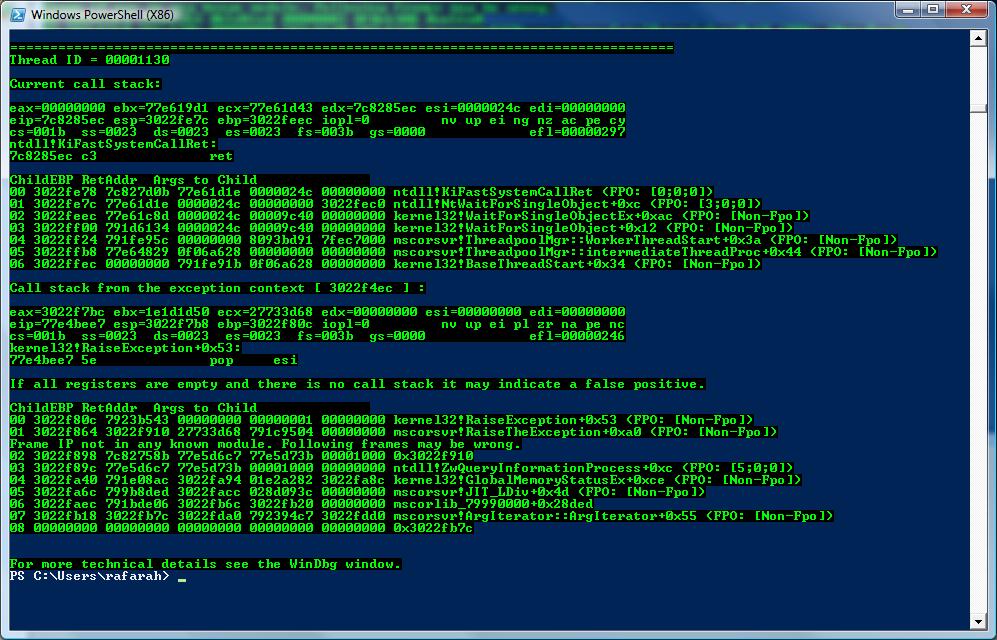
This is the source code for PowerDbgScriptExceptions.ps1:
########################################################################################################
# Script: PowerDbgScriptExceptions
#
# Parameters: None.
#
# Purpose: Show all threads that handled exceptions and the corresponding call stack for each inner exception.
# This script is for 32 bits.
#
# Usage: Before running the script:
# a) Open your workspace to load the symbols.
# b) .wtitle PowerDbg
# c) .reload /f
#
# Attention! If you don't load the symbols before running the script you may face timing issues.
#
# Changes History: 03/29/08 - Removed all start-sleep from the code. PowerDbg version 3.0 and later
# doesn't require it anymore.
#
# 01/23/09 - This script was changed to be compatible with PowerDbg v5.0
#
# Roberto Alexis Farah
# All my functions are provided "AS IS" with no warranties, and confer no rights.
########################################################################################################
set-psdebug -strict
$ErrorActionPreference = "stop"
trap {"Error message: $_"}
write-Host "Finding hidden exceptions..." -foreground Green -background Black
# Just cleans WinDbg window...
Send-PowerDbgCommand ".cls"
# The command below search all threads for the exception context.
# It shows the thread id and all exception contexts found in each call stack. Scanning all the call stack.
Send-PowerDbgCommand "~* e r @`$tid;.echo CONTEXT;s -[1]d poi(@`$teb+0x8) poi(@`$teb+0x4) 0001003f ; .ECHO END_CONTEXT"
write-Host "Done!" -foreground Green -background Black
# Extract output removing commands.
$builder = New-Object System.Text.StringBuilder
$key = ""
$value = ""
$oldTID = ""
$output = @{}
$hasExceptions = $false
$stringReader = [System.IO.StringReader] $global:g_commandOutput
# Scan the symbols for each thread, line by line.
while(($line = $stringReader.ReadLine()) -ne $null)
{
# Gets the thread ID. We'll need this information later.
if($line -match "(^\`$tid=(?<key>(\w+)))")
{
# Save the key that in this case is the thread ID.
$key = $matches["key"]
}
elseif($line -match "(^0x(?<value>(\w+)))") # Gets thread context.
{
# We can have more than one different exception context for each thread.
# For this case the value is the exception context.
$value = $matches["value"]
# If this flag is true we found exceptions.
$hasExceptions = $true
# Check if we changed threads.
if($oldTID -ne $key)
{
$oldTID = $key
write-Host "`n===================================================================================" -foreground Green -background Black
write-Host "Thread ID = $oldTID" -foreground Green -background Black
write-Host "`nCurrent call stack:`n" -foreground Green -background Black
# Changes the thread context.
Send-PowerDbgCommand "~~[$oldTID]s"
# To get the registers we can just get the content from the output file.
write-Host $global:g_commandOutput -foreground Green -background Black
# Gets the call stack. This is the original call stack. We didn't change the exception context.
Send-PowerDbgCommand "kbn 1000"
# Parses the command output.
Parse-PowerDbgK
# Gets the output.
$output = Convert-PowerDbgCSVtoHashTable
# Displays the call stack replacing the g_frameDelimiter by new line.
write-Host $output["#"].Replace($global:g_frameDelimiter, "`n") -foreground Green -background Black
}
# Displays call stack from the exception context.
write-Host "Call stack from the exception context ["$value" ] :" -foreground Green -background Black
write-Host ""
# Changing exception context...
Send-PowerDbgCommand ".cxr $value"
# To get the registers we can just get the content from the output file.
write-Host $global:g_commandOutput -foreground Green -background Black
write-Host "If all registers are empty and there is no call stack it may indicate a false positive.`n" -foreground Red -background Black
# Gets the call stack. This is the original call stack. We didn't change the exception context.
Send-PowerDbgCommand "kbn 1000"
# Parses the command output.
Parse-PowerDbgK
# Gets the output.
$output = Convert-PowerDbgCSVtoHashTable
# Displays the call stack replacing the g_frameDelimiter by new line.
write-Host $output["#"].Replace($global:g_frameDelimiter, "`n") -foreground Green -background Black
}
}
# Notifies user if there is no exceptions.
if($hasExceptions -eq $false)
{
write-Host "`nThis process has no threads handling exceptions or threads with hidden exceptions." -foreground Green -background Black
}
write-Host "`nFor more technical details see the WinDbg window." -foreground Green -background Black
# Notifies user the script finished the execution.
Send-PowerDbgComment "PowerDbgScriptExceptions was executed. See the PowerShell window for more information."
Have fun!
Comments
Anonymous
January 15, 2008
PingBack from http://msdnrss.thecoderblogs.com/2008/01/15/powershell-script-displaying-the-call-stack-for-inner-and-hidden-exceptions/Anonymous
April 03, 2008
New version. Now it doesn't use start-sleep anymore because PowerDbg v3.0 and later doesn't require forced delays anymore!Anonymous
October 14, 2008
Hi, About error when opening "C:Arquivos de programasDebugging Tools for Windows x86POWERDBG.LOG" I do this :
- desinstall "Debugging Tools for Windows (x86)" because this is installed in this path : "C:Arquivos de programasDebugging Tools for Windows (x86)"
- reinstall in new path : ""C:Arquivos de programasDebugging Tools for Windows x86" The new path don't have parenthesis in name, like first default installation.
Anonymous
October 16, 2008
Hi ISalamon, One week ago a co-worker reported the same problem. This is a bug in PowerDbg code, when handling parentesis. I´d suggest the same workaround you already applied. Soon the tool is going to use a COM object to communicate with WinDbg, so hopefuly this problem will be solved. :) Thanks!Anonymous
February 03, 2009
I’m very excited to present the new PowerDbg v5.0! There’s just one change, but it’s a HUGE change thatAnonymous
March 19, 2009
So, here we go again. This is a minor version with a few new cmdlets. These new cmdlets are those thatAnonymous
April 14, 2009
This version has two improvements and some scripts were changed to be compatible with this new version: