SQL Mysteries: SQL Server Login Timeouts – A Debugging Story
This blog takes you through the debugging journey, refreshing us on old concepts and introducing some new ones.
Reported Symptoms
· Random connection failures from both SQL Authentication and AD based logins
· Failures occur from remote clients or sqlcmd executed directory on the server (/opt/mssql-tools/bin)
· Unpredictable when failures occur
· Non-yielding scheduler reports
· SQL Server 2017 CU10 does not show behavior
· SQL Server 2017 CU12 exhibits the behavior
· Server is a Superdome with lots of CPUs and RAM
Health Session Information
One of the first stops in debugging this issue is the SQL Server health session traces located in the /var/opt/mssql/log/system_health*.xel files. You may view and adjust the XEvent health session from SQL Server Management Studio (SSMS).
- Watch live data
- Right mouse | Properties to adjust the session
- Right mouse | Script Session as …
Several event types are included in the health session, some of which include predicates to remove noise from the system health session.
- sqlclr.clr_allocation_failure
- sqlclr.clr_virtual_alloc_failure
- sqlos.memory_broker_ring_buffer_recorded
- sqlos.memory_node_oom_ring_buffer_recorded
- sqlos.process_killed
- sqlos.scheduler_monitor_deadlock_ring_buffer_recorded
- sqlos.scheduler_monitor_non_yielding_iocp_ring_buffer_recorded
- sqlos.scheduler_monitor_non_yielding_ring_buffer_recorded
- sqlos.scheduler_monitor_non_yielding_rm_ring_buffer_recorded
- sqlos.scheduler_monitor_stalled_dispatcher_ring_buffer_recorded
- sqlos.scheduler_monitor_system_health_ring_buffer_recorded
- sqlos.wait_info
- sqlos.wait_info_external
- sqlserver.connectivity_ring_buffer_recorded
- sqlserver.error_reported
- sqlserver.security_error_ring_buffer_recorded
- sqlserver.sp_server_diagnostics_component_result
- sqlserver.sql_exit_invoked
- sqlserver.xml_deadlock_report
The non-yielding, wait_info* and connectivity events provide the required information for this issue. Looking at the health records the following pattern repeatedly appeared.
The events logged in the system health show a non-yield beginning, then a login timeout occurring and the non-yield ending.
connectivity_ring_buffer_record
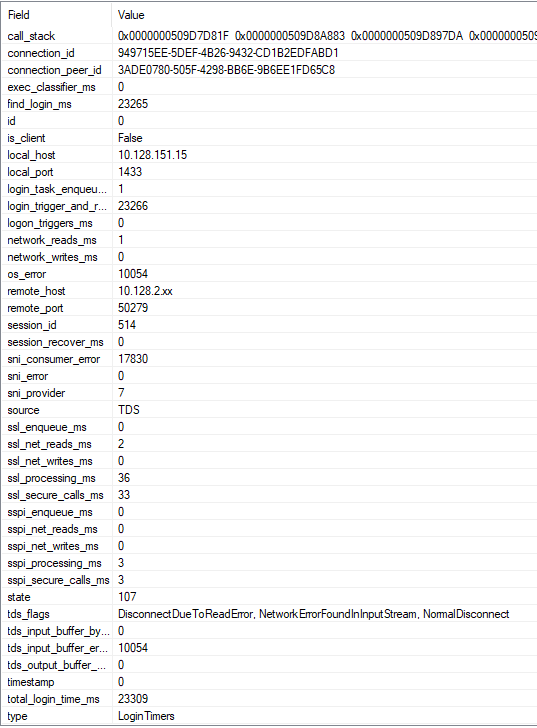
Drilling into the connectivity ring buffer record details emerge.
When a connection attempt fails the type=LoginTimers record is recorded, providing timings for the login activity.
Starting with the total_login_time_ms = 23390 the events point the failed login attempt of 23.3 seconds. The SSL exchange time was low but the login_trigger_and_resource_governor_ms value consumed the majority of the time.
The find_login_ms event was another consumer and is child of the login_trigger_and_resource_governor_ms.
How would one know which timings are parent or child values? Looking at the LoginTimer ring buffer entry you uncover the relationships.
select * from sys.dm_os_ring_buffers
where ring_buffer_type = 'RING_BUFFER_CONNECTIVITY'
The ring buffer, XML format outputs the parent and child relationships. This LoginTimes snippet shows the timing information (full record contains additional information for SSL, SSPI, reads, writes, etc.)
<Record id="2" type="RING_BUFFER_CONNECTIVITY" time="591262106">
<ConnectivityTraceRecord>
<RecordType>LoginTimers</RecordType>
<LoginTimersInMilliseconds>
<TotalTime>23309</TotalTime>
<EnqueueTime>0</EnqueueTime>
<NetWritesTime>0</NetWritesTime>
<NetReadsTime>0</NetReadsTime>
<TriggerAndResGovTime>
<TotalTime>23266</TotalTime>
<FindLogin>23265</FindLogin>
<LogonTriggers>0</LogonTriggers>
<ExecClassifier>0</ExecClassifier>
<SessionRecover>0</SessionRecover>
</TriggerAndResGovTime>
</LoginTimersInMilliseconds>
</ConnectivityTraceRecord>
This information quickly rules out a login trigger or classifier function as the cause of the problem. As you might imagine from the name SQL Server is looking up the login information and contacting the AD if necessary, as part of the login validation. This means we are reading database pages from the master, acquiring locks, and making calls to the domain controller (DC/KDC.)
wait_info*
Another observation is that the system health session did not conatain wait_info* events longer than 5-seconds. The lack of wait_info* events is revealing because if we are waiting for a database read, lock or preemptive, external call for more than 5 seconds an event would have been logged. This means that we are unlikely encountering issues with database reads, locking or a preemptive, external call.
Network Trace
Looking at network traces helps build our understanding of the problem.
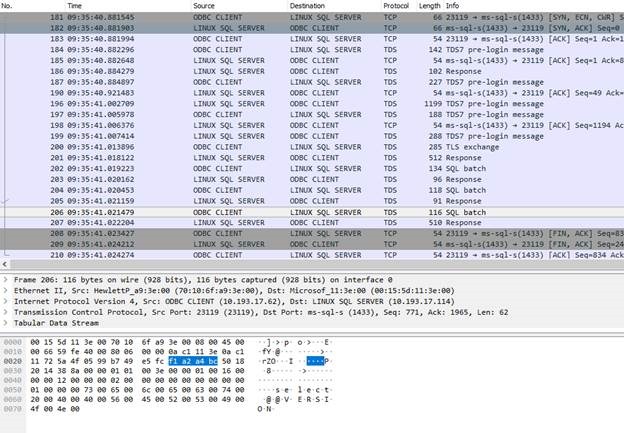
Normal SQL Login, execute select @@VERSION and logout
Here is an example of a valid SQL Server login.
1. TCP connection establishment from the ODBC CLIENT to the LINUX SQL SERVER (SYN)
2. TDS pre-login exchange
3. 512 byte response (use database context xxxxxx, default language xxxxxxx, test size xxxxx)
4. SQLBatch (select @@VERSION)
5. FIN – Close of TCP connection | Disconnect
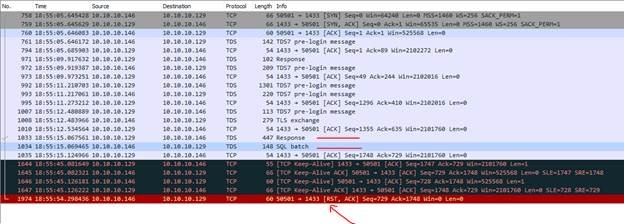
Failing Login
Here is an example of a failed SQL Server login.
1. TCP connection establishment from the ODBC CLIENT to the LINUX SQL SERVER (SYN)
2. TDS pre-login exchange
3. Login response
4. Keep alive kicks in and time begins to elapse without other activity
5. RST – TCP connection is reset by client (OS Error: 10054)
There were several failure variations but the most common waits occurred handling the login response.
Network Layer Overloaded
In contrast to the failing SQL Server login, this is what a network trace looks like when the network layer becomes overloaded and is not completing requests to the SQL Server. Usually, you start seeing retransmission of the SYN.
Attempting A Reproduction
Now we have an idea about the pattern, a reproduction would be helpful to track the problem and make sure it is properly resolved. This is where my old friend (ostress) came in handy.
"C:\Program Files\Microsoft Corporation\RMLUtils\ostress" -Usa -Pxxxxxxx -Q"--" -Stcp:10.193.17.114 -q -n64 -r99999999 -cc:\temp\sample.ini -T146 -oc:\temp\output
- Use -U and -P for SQL authentication
- Use -E for AD authentication
- -q ignores query results
- -S target server name forcing tcp protocol
- -Q with a query of -- (comment only to do nothing)
- -n controls the number of threads
- -r controls the number of loops for each thread
- -c the control file
- -T146 disable encrypted TDS
- -o output location
In the control file set DisconnectPct=100.0. This directs ostress to connect, execute the query --, disconnect 100% of the time and then repeat -r times for each of the -n threads.
Tracing XEvent login and logout events you can see the connect and disconnect activities. The following is a simple query for looking at the rate of login and logouts the test is accomplishing.
drop table #before
go
drop table #after
go
select * into #before
from sys.dm_os_performance_counters where counter_name in ('Logins/sec', 'Logouts/sec')
waitfor delay '00:00:10'
select * into #after from sys.dm_os_performance_counters where counter_name in ('Logins/sec', 'Logouts/sec')
select b.object_name, a.cntr_value - b.cntr_value as [diff], (a.cntr_value - b.cntr_value) / 10.0 as [Rate/sec]
from #before b
inner join #after a on a.counter_name = b.counter_name
I started with a cmd file script exercising the connection path.
start "ostress" "C:\Program Files\Microsoft Corporation\RMLUtils\ostress" -E -Q"--" -Stcp:xxxxxxx -q -n32 -r99999999 -cc:\temp\sample.ini -T146 -oc:\temp\output
start "ostress" "C:\Program Files\Microsoft Corporation\RMLUtils\ostress" -E -Q"--" -Stcp:xxxxxxx -q -n32 -r99999999 -cc:\temp\sample.ini -T146 -oc:\temp\output2
:top
sqlcmd -E -Stcp:xxxxxxx -Q"select @@VERSION"
ping -n 10 xxxxxxxx
goto top
Windows TCP Settings
As I cranked up the stress level on a 2TB, 144CPU system I hit some TCP issues.
Running along and all the sudden no traffic occurring at the SQL Server for a few seconds, then stress kicked back in. During the downturn in activity a local /opt/mssql-tools/bin/sqlcmd connection continued to work.
I started using the following bash script running locally on the Linux SQL Server system to see successful connections while the remote connections were failing.
while [ 1 -gt 0 ]
do
echo
echo $(date)
./sqlcmd -Usa -Pxxxxxxx -Q"select @@VERSION" -Stcp:.
sleep 2
done
The stall and go behavior occurred because I was running out of Windows client TCP ports. Using netsh we adjusted the client port range and the stop and go behavior went away.
netsh int ipv4 show dynamicport tcp
netsh int ipv6 show dynamicport tcp
netsh int ipv4 set dynamicport tcp start=10000 num=50000
netsh int ipv6 set dynamicport tcp start=10000 num=50000
Now I began driving high levels of connect and disconnect operations until I started seeing network saturation (SYN with retransmits) but I was not seeing the non-yield pattern.
Disrupt The Domain Controller (keytab)
Knowing the find login path was doing domain controller calls the next thing I did was pause the domain controller VM and poof – non-yielding occurred with connection timeouts, high times recorded in find login. My collogue was able to add entries to the keytab file (invalid DC targets) that exhibited long KDC/DC query behavior as well.
We then found a few code paths in find login that did not switch to preemptive before making a call to SSSD or LDAP for Linux, AD activities. Since SQL Server did not switch preemptive there is no wait_type* records in the system health log.
Non-Yielding Scheduler
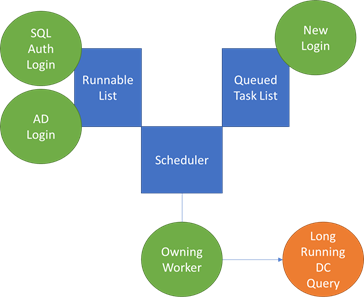
Non-yielding is the key to the issue and the associated behaviors. The following diagram help highlight the problems experienced.
The owning worker made a call to the domain controller without switching off the SQL Server scheduler (preemptive.) You have a SQL authentication and AD authentication workers part of the way through the pre-login sequence and yielded. When the owning worker yields the runnable list is used to determine the next worker to execute. When the runnable list has reached max workers for the scheduler new requests are queued.
The KDC/DC query is taking more than 5 seconds and SchedulerMonitor (one per NUMA node) reports a non-yielding condition (BEGIN). Every 5 seconds the SchedulerMonitor checks progress, incrementing a pass count. When that pass count has reached the limit (12 == 60 seconds) a non-yielding situation is reported.
In the customer’s case the non-yield generally lasted 5 to 15 seconds, reported in the system health session with non-yielding BEGIN and END events bracketing connection timeout events.
Various login timeouts are then triggered. When the client detects the connection, timeout is reached the FIN is sent to close the TCP connection, usually bubbling up to SQL Server as error 10054 – connection closed.
· If the login was in the middle of processing pre-login the ring buffer entry may show time spent in SSL, reads, etc and the disconnect.
· If the login was stuck on the DC call the time generally accumulates in find login.
· If the login was queued to the scheduler you see 1 or 0ms elapsed times for login failure events. By the time the a worker was allowed to pick up the new task the client has already sent the 10054 and as soon as SQL Server attempts to process the login the connection is detected as closed and fails.
SQL Authentication Impact
Now you can see how an AD authentication could lead to SQL authentication, login timeouts. If the SQL authentication request was on the same scheduler as the stalled KDC/DC query the quest is impacted.
Other Schedulers Impacted
This code path does not engage in much SQL locking so a stalled user running the KDC/DC query usually does not impact other schedulers and the logins associated with those schedulers. Other schedulers are impacted by the KDC/DC query in two ways.
1. If other schedulers are trying to process AD logins and the KDC/DC queries are slow the queries are likely to encounter the same behavior.
2. If a non-yield is detected a dump is invoked. The dump suspends the SQL Server process. If the dump time exceeded the login timeout the client closes the connection and you commonly see a burst of 10054 TCP errors across the SQL Server schedulers.
Recap
The bug is in the find login code not going preemptive before querying the domain controller, leading to delays and login timeouts.
When fixed, individual AD login attempts still encounter login timeouts when experiencing delays from the KDC/DC query, but other logins and queries are no longer impacted.
Bob Dorr
Thank to test folks for helping track down and correct this issue.
Dylan Gray, Mike Habben, Mitchell Sternke, Val Menn, Kapil Thacker, Ben Ko, Madeline MacDonald, and Ethan Moffat
Comments
- Anonymous
February 19, 2019
we had the same issue 2018 on SQL2008I also notice there is no resolution here?"the DC is slow", or "stop hitting the server so hard" is the answer?


