Take most of Reporting Services Logs with Excel 2013
Hi everybody.
It’s been a while since I have posted in this blog about Reporting Services Logs and today we are going to put some of it in practice.
The purpose of this post is to use the newest version of Excel 2013 Customer Preview that can be found here and use PowerPivot and Power View embedded features to create a small BI solution for Reporting Services execution log. Yes, you’re reading it right: PowerPivot and Power View are now part of Excel 2013!
So let's get started!
Pre-requisites
Here are the pre-requisites:
- Have Microsoft Office 2013 Consumer Preview installed;
- Have reading permissions to Reporting Services database;
After installing Microsoft Office 2013 Customer Preview you need to check if PowerPivot and Power View features are enabled in Excel 2013. To do so, open Excel 2013, go to File, Options and choose Add-Ins section.
In the lower area of the window under Manage area, select COM Add-ins and click Go… . Here, verify if you have Microsoft Office PowerPivot for Excel 2013 and Power View options selected. If not, select them.
Now, go back to Excel main window and check if you have the PowerPivot tab and the Power View button under Insert tab like the following picture.
Build the data model
Let’s start building our data model to support Power View reports by defining two tables: one for date that will help on drilling-down by year, month or day; and another table for Reporting Services execution log records.
Go to PowerPivot tab and click Manage button. PowerPivot window will open. Here click on Get External Data button, choose From Database and then From SQL Server.
Now choose your Report Server database instance and Report Server database.
Click on Next and choose the option Write a query that will specify the data to import.
In Friendly Query Name textbox type RSExecutionLog and on SQL Statement textbox paste the following query from RSExecutionLog2 view from Report Server database:
 SELECT
 e.InstanceName,
 (CASE WHEN e.ReportPath = '' THEN '<interactive report>' ELSE e.ReportPath END) ReportPath,
 e.UserName,
 e.ExecutionId,
 e.RequestType,
 e.Format,
 '' as [Parameters],
 e.ReportAction,
 e.TimeStart,
 e.TimeEnd,
 e.TimeDataRetrieval,
 e.TimeProcessing,
 e.TimeRendering,
 e.Source,
 e.Status,
 e.ByteCount,
 e.[RowCount],
 '' as AdditionalInfo,
 CONVERT(char(10), e.TimeStart, 112) DateKey
 FROM dbo.ExecutionLog2 e
ORDER BY e.TimeStart
Click on Validate button to check if syntax is OK. Click on Finish button to import data into PowerPivot data model.
After importing database records into PowerPivot you should get a window similar to the next picture:
In PowerPivot main window you will see your database records that where read from RSExecutionLog2 view.
Now we will create a date table into PowerPivot in order to drill-down information through time. To do so, in PowerPivot main window click on Get External Data button but choose Existing Connections and then chooseyour connection previously created.
Choose Open button and choose the option Write a query that will specify the data to import.
In Friendly Query Name textbox type Date and on SQL Statement textbox paste the following query from RSExecutionLog2 view from Report Server database:
 SELECT DISTINCT
 CONVERT(char(10), e.TimeStart, 112) DateKey,
 CONVERT(char(10), e.TimeStart, 105) Date,
 YEAR(e.TimeStart) Year,
 MONTH(e.TimeStart) Month,
 DAY(e.TimeStart) Day
 FROM dbo.ExecutionLog2 e
 ORDER BY 1
Click on Validate button to check if syntax is OK. Click on Finish button to import data into PowerPivot data model.
After importing database records into PowerPivot you should get a window similar to the next picture:
Again you will see imported data into PowerPivot window.
Now that we have imported our records into PowerPivot, you will need to create a relationship between DateKey column on each imported table in order to relate the date table to Execution Log records. To create a relationship, click on Create Relationship button in the PowerPivot window and set the relationship direction like the following picture. After choosing your options click on Create.
Create the Power View report
Now you are ready to analyze your data! Close PowerPivot window and return to Excel main window.
Go to Insert tab and choose Power View button. Excel will open a new Power View canvas ready to add fields from PowerPivot data. This canvas is nothing more than a new Excel worksheet.
Let’s try to answer the following question: How many reports are my Report Servers executing per month?
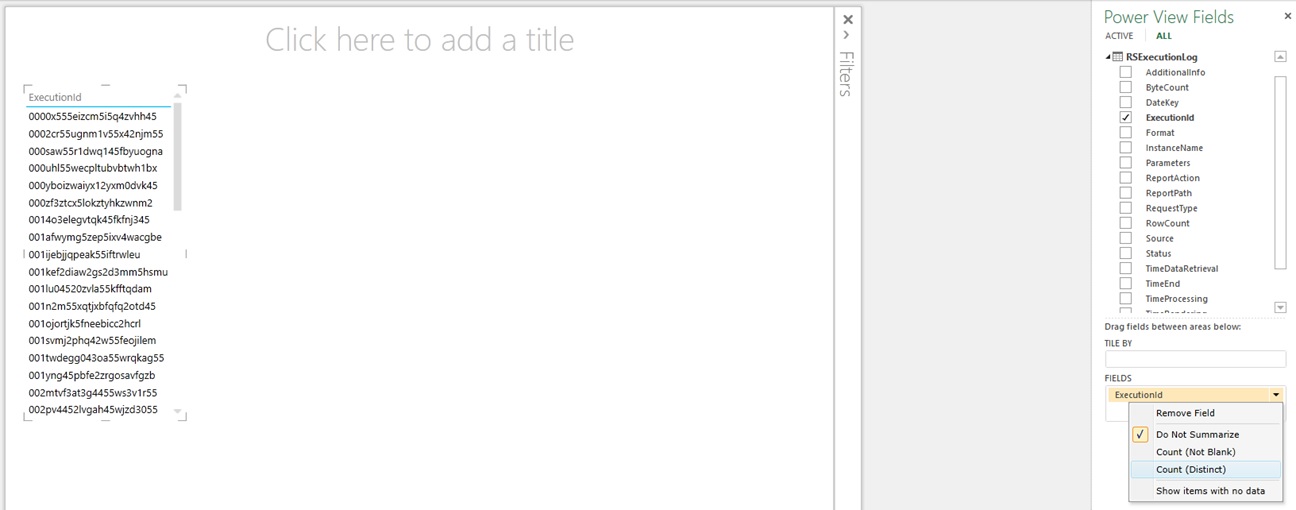
Go to Power View Fields list in right side and expand RSExecutionLog tree node. This can be done by clicking in the arrow before the name. Choose ExecutionId Field by clicking on the checkbox before the name. Automatically, Power View adds a table in the canvas with each ID value that was imported from RSExecutionLog table in PowerPivot. Each ID represents a report execution in Reporting Services.
Since we want to count the number of executions we need to change the field type. Go to Fields area in the right, click in the down arrow next to ExecutionId name and choose to summarize by Count (Distinct) .
Notice that the table in the canvas changes to a number. This is the total number of executions.
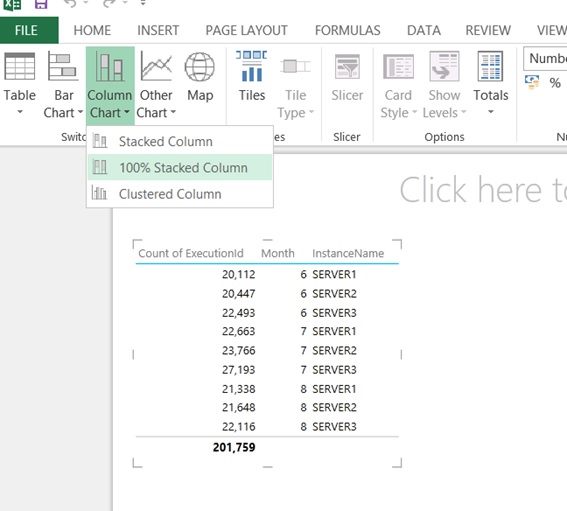
Now that we have the number of executions, let’s add more detail. From Date field list choose Month and from the RSExecutionLog field list choose InstanceName field and.
You should get a table similar to one in the following picture. ATTENTION: You need to add the fields in this order because if not the axis in the chart will be switched.
To make the visualization more interesting to users, click on the table in the canvas an go to Design tab and choose 100% Stacked Column option under Column Chart button. Automatically Power View changes the layout into a bar chart.
Since it’s too hard to understand which percentage of requests were done on each server, we will add data labels. With the graph selected, go to Layout tab and under Data Labels choose Show.
Here you go. You should have a graph similar to the following picture. Remember that in this example we used a Report Server database already prepared for this post and your results might look different.
Conclusion: It seems that our three server infrastructure is balancing correctly since the percentage of requests are pretty close.
Challenge
As a challenge, try to answer this question with the same data and with Power View: What is the rate of requests per error type by month? Tip: Use Status field that don’t have rsSucess value and use a Pie Chart for visualization.
See you next time!
Disclaimer: I hope that the information on these pages is valuable to you. Your use of the information contained in these pages, however, is at your sole risk. All information on these pages is provided "as -is", without any warranty, whether express or implied, of its accuracy, completeness, fitness for a particular purpose, title or non-infringement, and none of the third-party products or information mentioned in the work are authored, recommended, supported or guaranteed by Ezequiel. Further, Ezequiel shall not be liable for any damages you may sustain by using this information, whether direct, indirect, special, incidental or consequential, even if it has been advised of the possibility of such damages.
Comments
- Anonymous
October 07, 2012
Thanks for these tables, heres a different take on excel reports that I found it amusing :) www.excelreports.info/excel-as-a-report-design-tool-yes/


