Visual Studio Team Services - Creating a build pipeline (Part 4)
In part 1 a basic Azure Web App website was built and deployed using VSTS Build and Part 2 illustrated how additional files could be included when building a web project. Part 3 demonstrated how Gulp could be added to the VSTS Build pipeline. This post is an introduction to bringing in Load Testing to the build pipeline.
Performance Tests
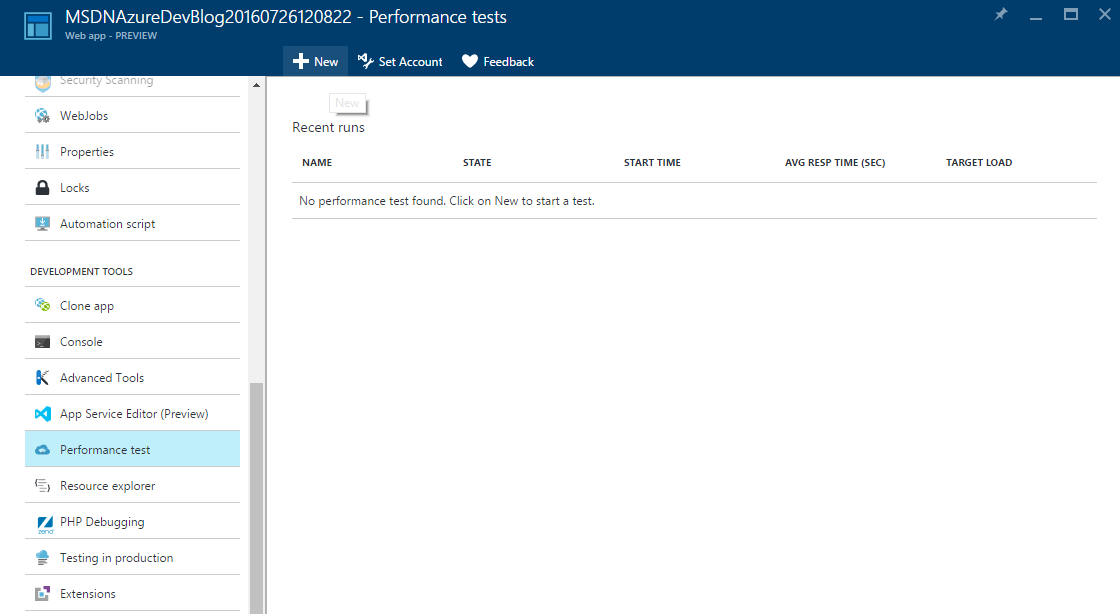
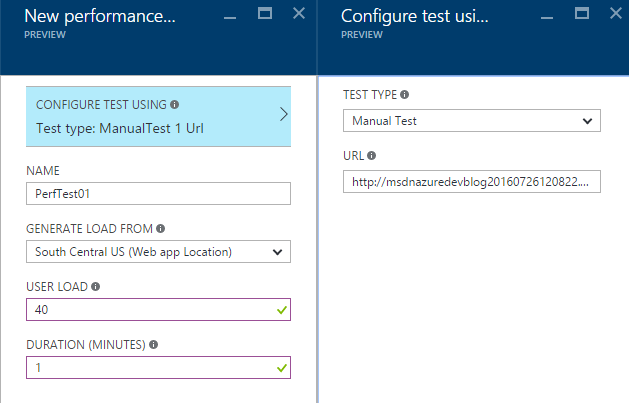
In the Azure Portal there is the ability to run light-weight performance test by performing a GET request against a specified page. For details see the references section, but the following is a quick summary. First, in the Development Tools -> Performance tests section use New to create a new test:
The Manual Test allows for a test allows for a number of users over a period of time to request a page from the web app.
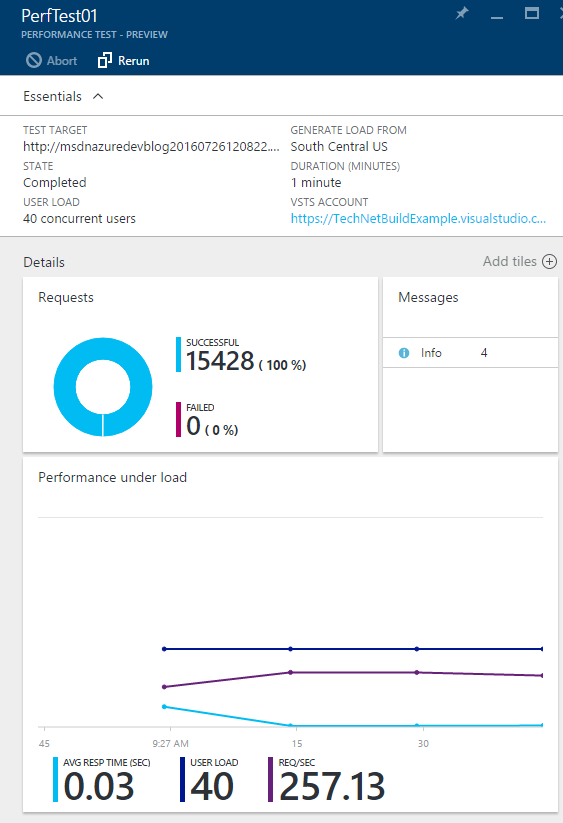
The performance test does maintain a history of recent tests allowing for changes in behavior over time to be identified.
As well as being able to identify failures and to get an indication of the general performance of the site.
References
Web Performance and Load Test Project
For more advanced testing scenarios, Apache JMeter or Microsoft's Web Performance Tests can be used. In this post a load test will be created using Visual Studio so the Web Performance Test will be used.
Note: Web Performance and Load Test Project is a Visual Studio Enterprise feature. Try Apache JMeter for professional and community editions.
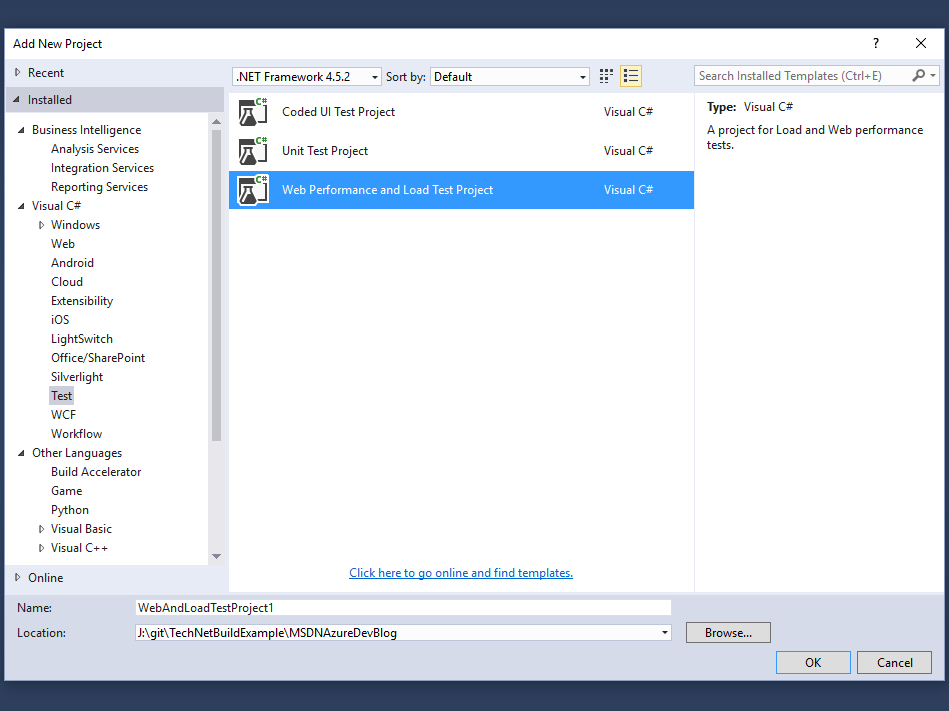
To begin a new Web Performance and Load Test Project is added to the solution:
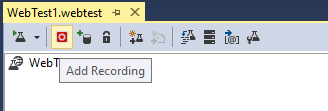
Add Recording
The easiest way to get started is to use the Add Recording feature. By adding a recording, a scenario can be quickly added to the web test and then edited if required.
If this is the first time, it is likely two add-ons will need to be enabled:
Make sure the two add-ons below are Enabled.
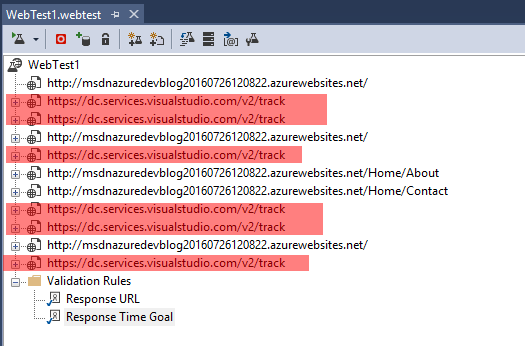
After performing some steps within the web app, the recording can be stopped. In some cases and especially on development machines, additional activity might be captured and added to the web test. These can be simply deleted from the steps as illustrated below:
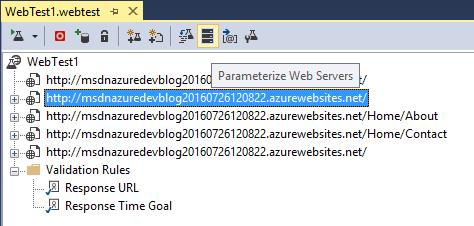
Tip - If you are developing for multiple deployments or environments (re., dev, test, prod), it is useful to parameterize the web service calls.
References
Add Validation Rule
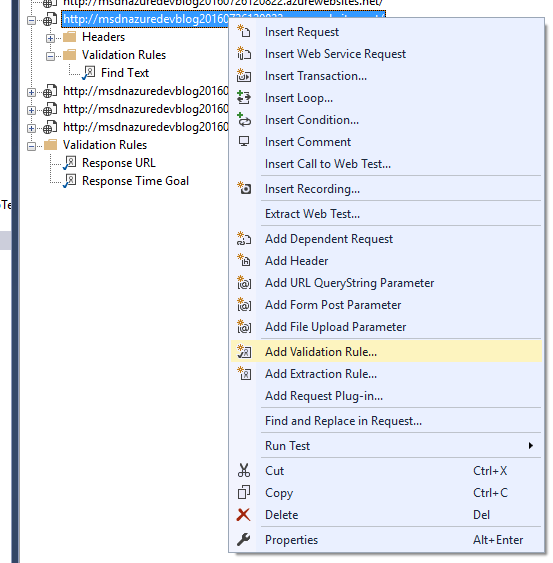
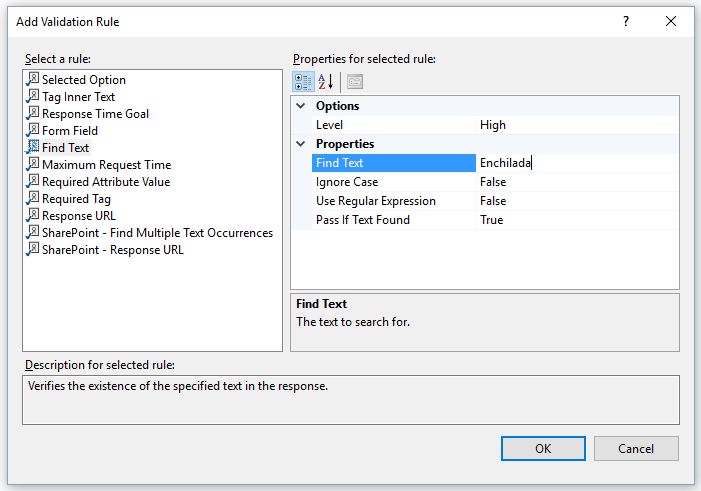
Once a test plan is created, additional steps and rules can be applied. For example, if we wanted to add a rule to validate if the text "Enchilada" was returned in a request, then we could add a rule by right clicking on the web request and selecting Add Validation Rule:
The Find Text rule can be added to simply check for a specified text in the response:
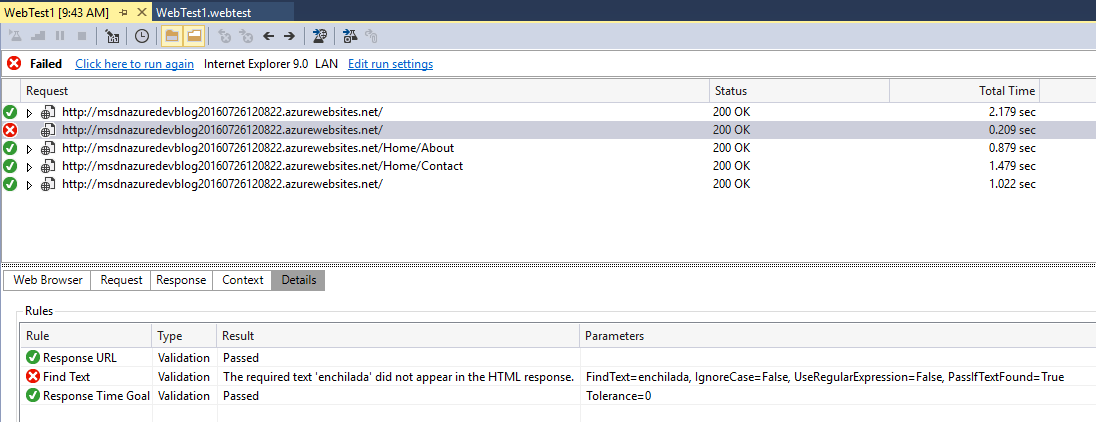
As the web app does not return enchilada on the dashboard, the validation rule fails as shown below and provides detail as to reason for the failure:
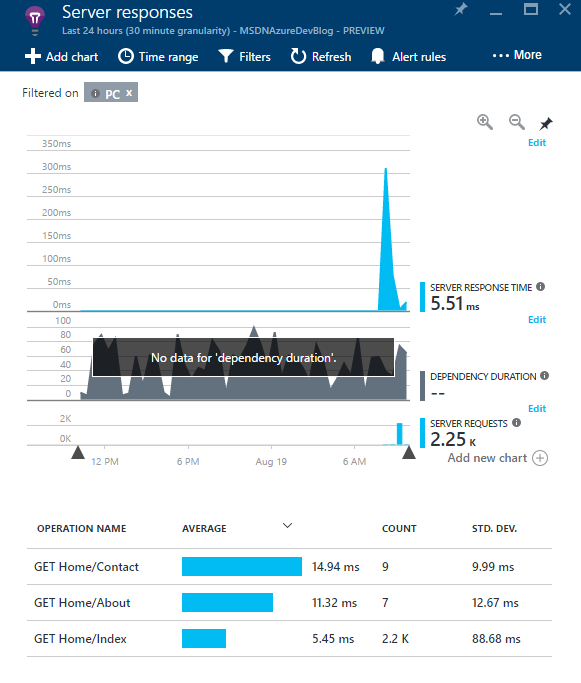
Using the Application Insights monitoring that was create in Part 2, we can see the contact page appears to be slower page compared to the other pages:
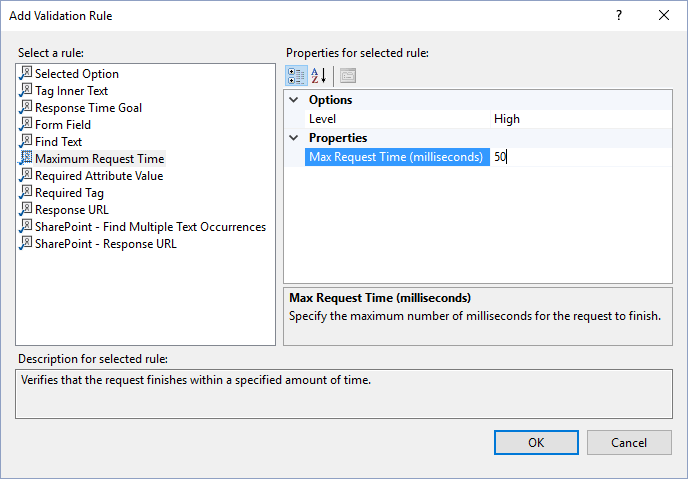
The following demonstrates how to create a validation rule for response time.
If the response time is greater than 50 milliseconds then the request is considered a failure:
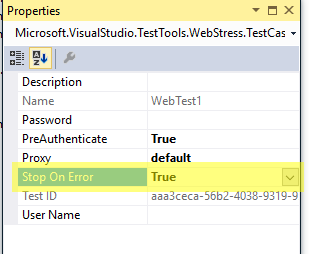
Tip - The sequence and behavior of the test steps can be altered. For example, if the test should stop on a failure, this can be specified on the test plan properties:
Below shows the test run being aborted after the contact web request failure:
References
Load Testing
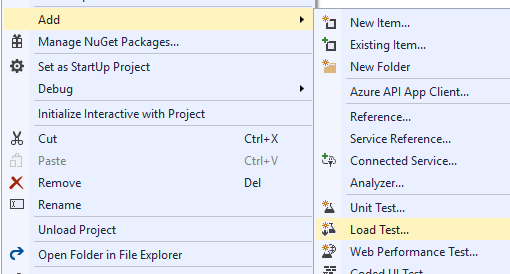
Once one or more web tests have been created, it is very easy to enable Load Testing. In the same test project, add a load test to start New Load Test Wizard:
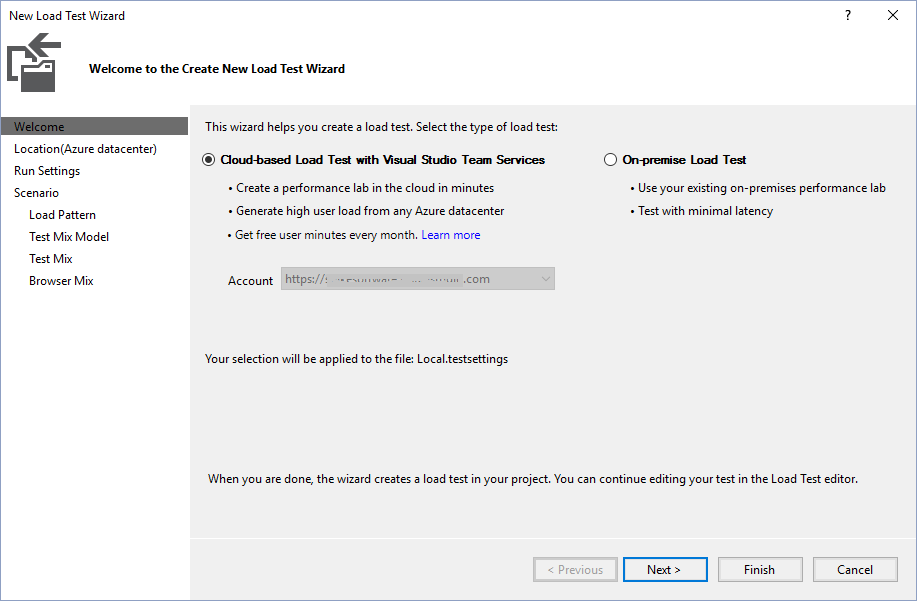
For this example, a cloud-based load test will be created:
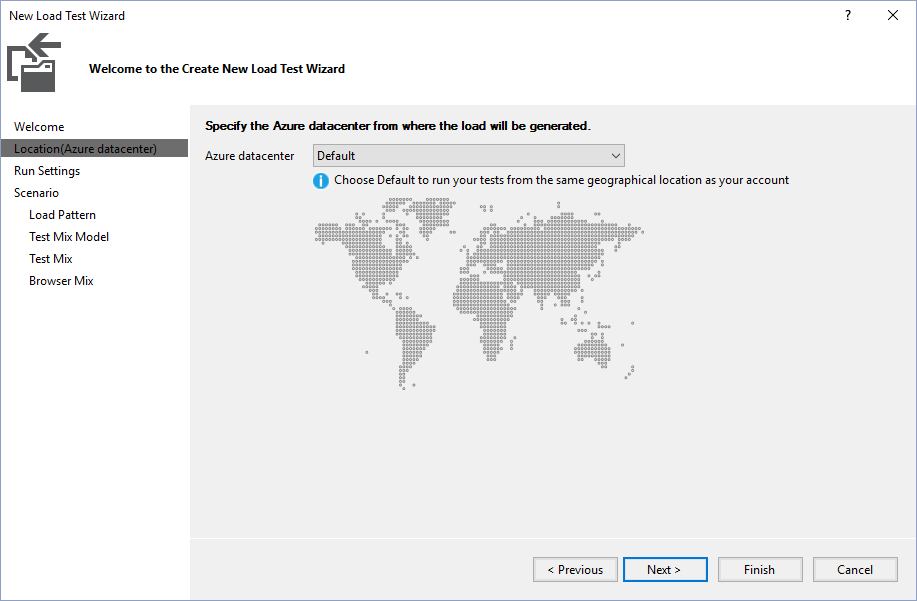
The default datacenter, in this case the same as where the web test is hosted, will be chosen:
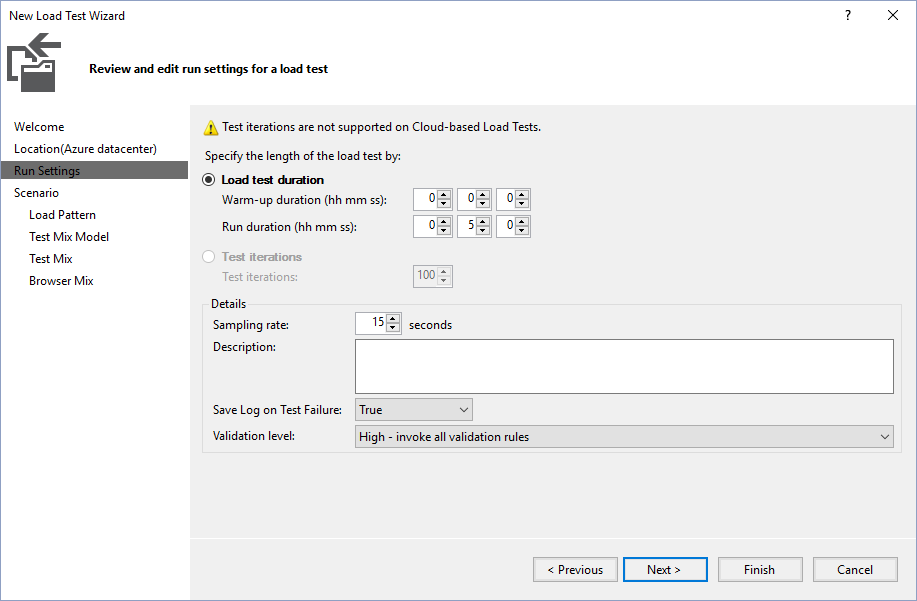
The duration of the test will be five minutes:
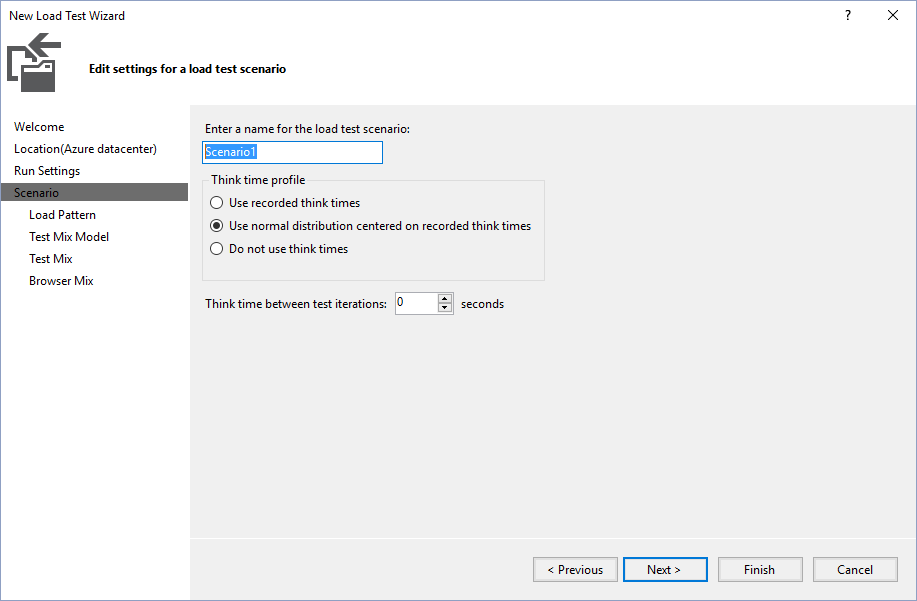
The scenario name as well as think times can be specified next:
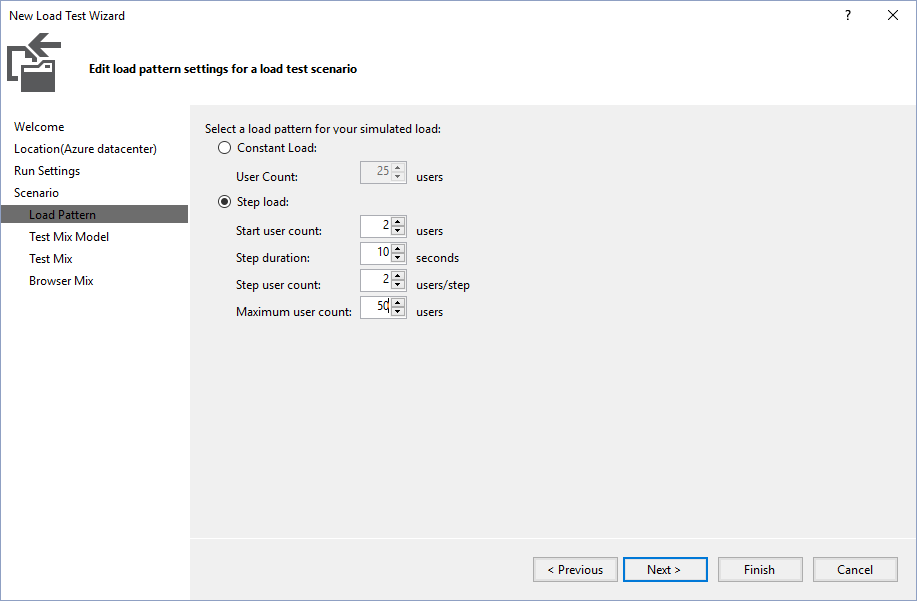
As an illustration of step load, the user count will start at 2 users and then gradually increase to 50 by adding 2 every 10 seconds:
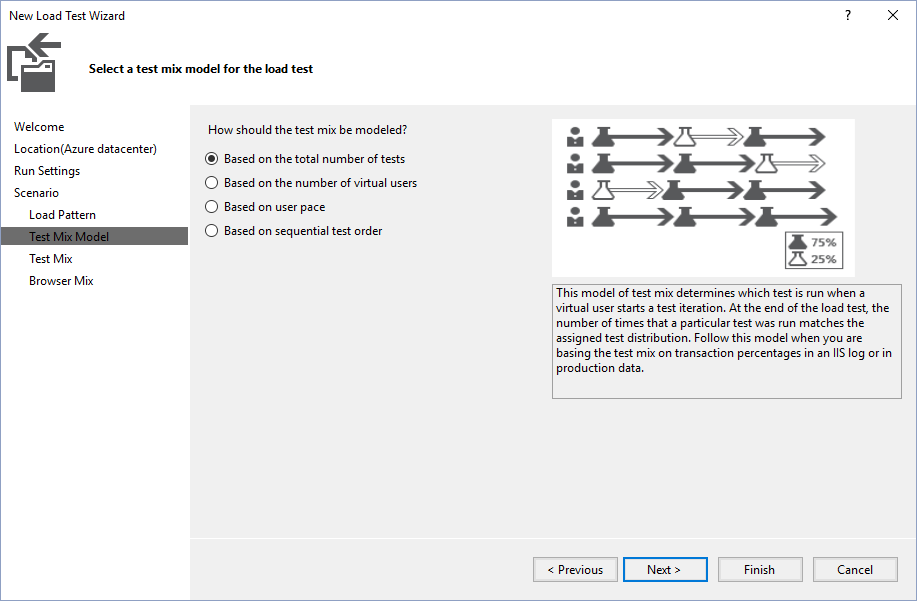
The test mix can also be specified when running multiple tests in one simulation:
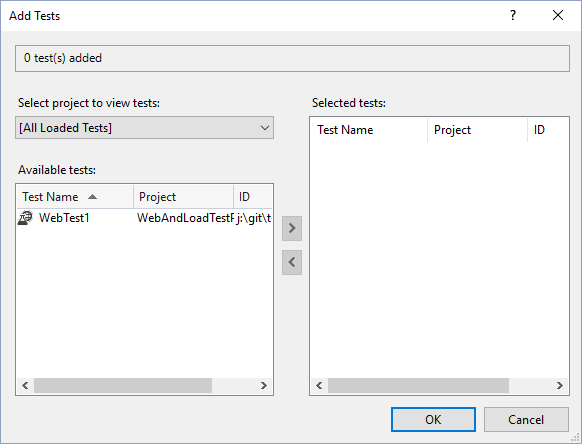
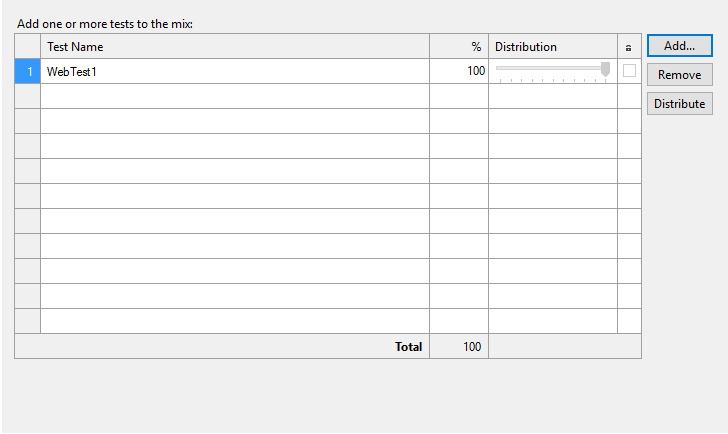
In this scenario, the single web test will be added:
Note the ability to alter the distribution when multiple tests are specified:
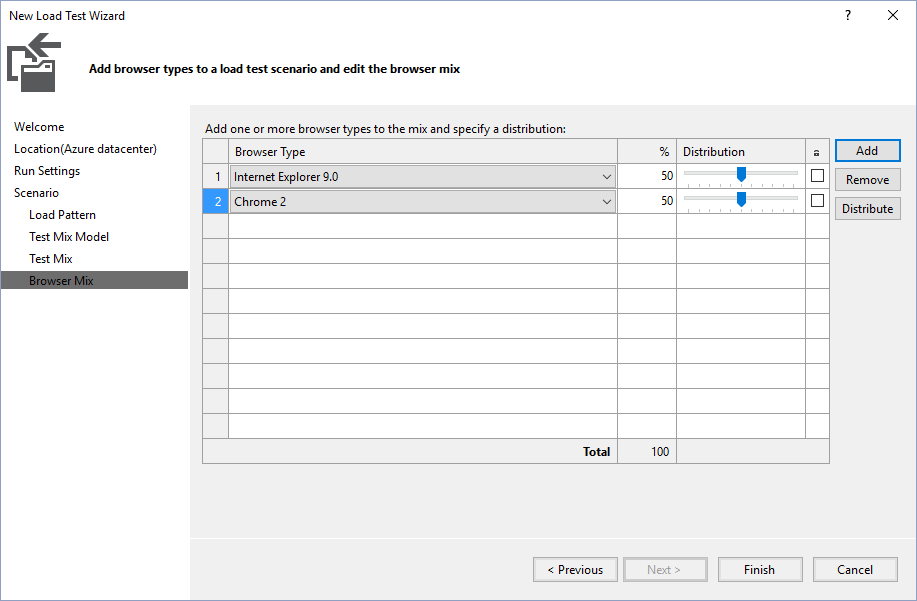
Another nice feature is the ability to distribute the load between different browser types:
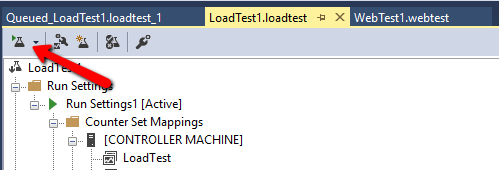
After the load test wizard has been finished, the load load can be launched!
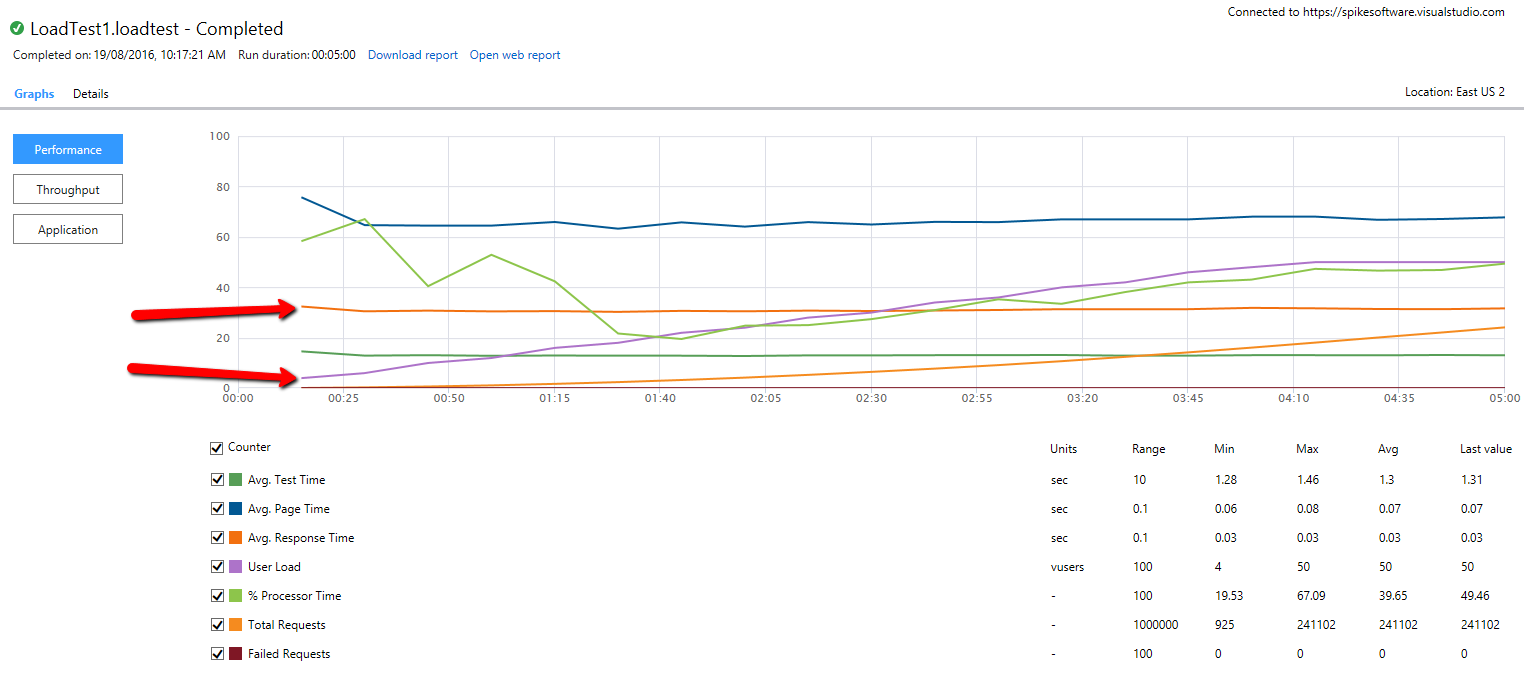
Once the load test has completed, a report is generated showing the results. Note the how as the user count increases (User Load), the Average Response and Average Page Time does not increase.
References
Setting up Load Testing in the build pipeline
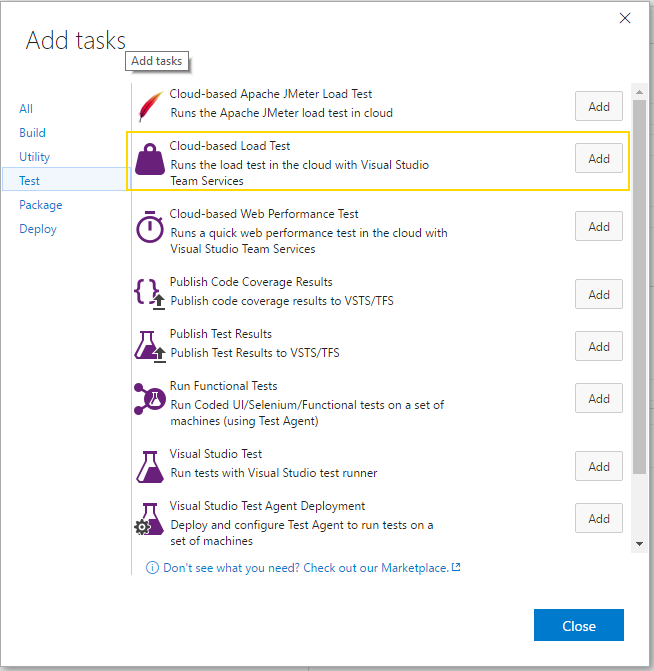
Setting up a Load Test task is surprisingly easy. The first step is to add a Cloud-based Load Test task to the build pipeline:
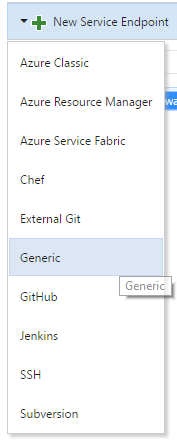
The task can be used to launch the load test on a registered connection allowing for the load test to be run on on-premises or cloud based servers. The first step is to register a new connection. Note the short cut:
The connection type is a Generic Service Endpoint.
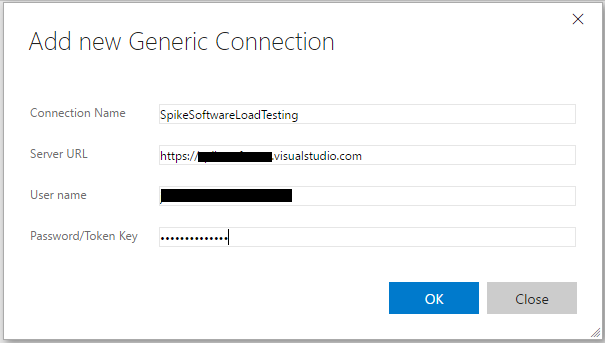
In this example, the connection will be for the VSTS account that is running the load tests.
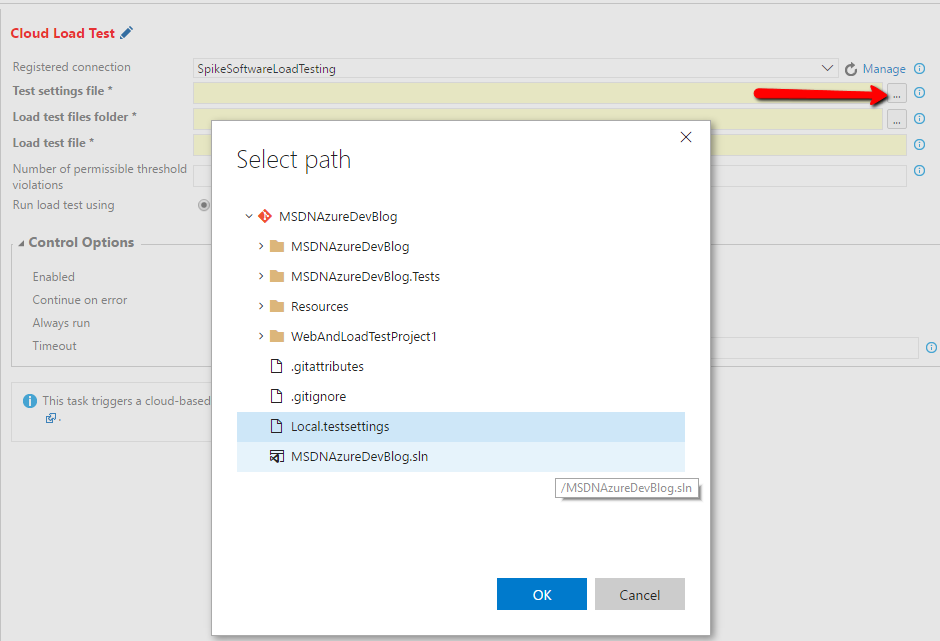
The remainder of the settings are relatively straightforward and reference the load test and settings that were created in the steps above. One thing to note is the helpful select dialog available:
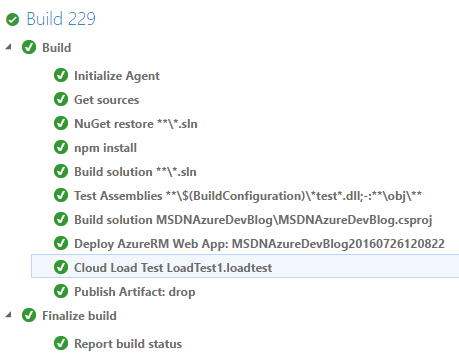
Once the task has been configured then the load test will be run as part of the build:
References
- Testing Tools and Services
- Cloud Based Load Testing
- Cloud Load Test Build Task information
- Scheduling Load Test Execution
Summary
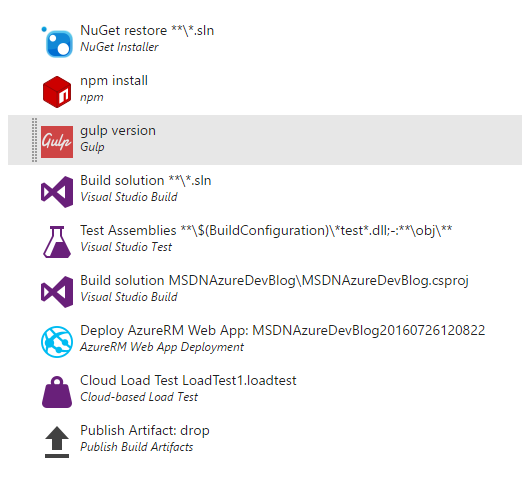
The following shows the current build pipeline:
Next Steps
In the next post, slots will be introduced to our build process and how they can work with our Load Test.
