Tracing with Storport in Windows 2012 and Windows 8 without KB2819476 hotfix
Welcome back to the CORE Team Blog. Paul Reynolds here. I would like to let everyone know about changes on how to capture Storport traces in Windows Server 2012 and Windows 8. Previously, Bob Golding wrote a blog on how to do this in Windows 2008 and Windows 2008 R2. If you have Windows 2008 or 2008 R2, continue to use that blog for your Storport traces.
Before we begin, there is a hotfix has been released that makes enhancements to Storport traces in Windows Server 2012 and Windows 8:
Update that improves the logging capabilities of the Storport.sys driver in Windows Server 2012
https://support.microsoft.com/kb/2819476/EN-US
A new blog post has been written for the new functionality and is located here:
Tracing with Storport in Windows 2012 and Windows 8 with KB2819476 hotfix
This blog post below is valid only for RTM builds of Windows Server 2012 and Windows 8 that DO NOT have the hotfix installed.
TRACE PREPARATION STEPS
We have two new steps that need to be done to enable Storport tracing on a Windows Server 2012 or Windows 8 machine:
1. Add a new registry key and property for each disk resource we want to capture Storport traces on:
Key to add:
HKEY_LOCAL_MACHINE\System\CurrentControlSet\Enum\SCSI\<DEVICEID>\<INSTANCE>\DeviceParameters\Storport
Property to add:
EnableLogoETW with a value of 1 (DWORD)
2. After adding these entries, a restart is required to make them effective. Yes, a reboot is required.
Many of you may have hundreds of LUNs. To help expedite adding these new registry keys and properties, here is a sample Windows PowerShell script that can help you automate the process:
$mydrives = get-item -path 'HKLM:\SYSTEM\CurrentControlSet\Enum\SCSI\*\*\Device Parameters\' | where {$_.PSPath -notlike "*Virtual*" -and $_.PSPath -like "*Disk*"}
foreach ($drive in $mydrives)
{
New-ItemProperty -Path registry::$drive\Storport -Name EnableLogoETW -Value 1 -PropertyType Dword
}
Once you are done, you can remove the added keys (if you wish, not necessary) also by running a Windows PowerShell script. Here is a sample script that can help you with that:
$mydrives = get-item -path 'HKLM:\SYSTEM\CurrentControlSet\Enum\SCSI\*\*\Device Parameters\' | where {$_.PSPath -notlike "*Virtual*" -and $_.PSPath -like "*Disk*"}
foreach ($drive in $mydrives)
{
remove-ItemProperty -Path registry::$drive\Storport -Name EnableLogoETW
}
TRACE GATHERING STEPS
After these keys and properties are added and the box rebooted, the process to capture a Storport trace becomes similar (though not identical) to the way we do it with Windows 2008 and Windows 2008 R2 (see Bob Golding’s blog for more detail). For those already familiar with the process, the two main changes are:
- Instead of choosing IOPERNOTIFICATION, a new choice called LOGO_PERMORMANCE is picked
- Request duration filters are no longer available
For those not familiar with the process, here is an overview of how to start a Storport trace. Most of the information is from Bob’s original blog.
1. Hit the Windows button and type Perfmon.exe, then press enter to start performance monitor.
2. Expand “Data Collector Sets” and “Event Trace Sessions”
3. Right-Click on “Event Trace Sessions”
4. Select “New, Data Collector Set”
5. The following dialogue will appear:
Give the new data collector set a name in the dialogue box. In this example I called it “Storport”.
6. Choose the “Create manually (Advanced) option and then click Next to see the following dialogue:
7. Click Add on the dialogue box above and the following list of providers will appear.
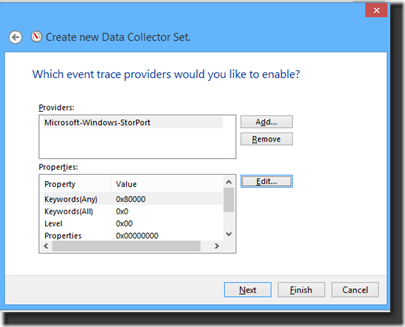
8. Select “Microsoft-Windows-Storport” and click OK. You should now see the following screen:
9. Select “Keywords (Any)” then click Edit.
10. Check the box for Logo_Performance, and then click OK:
11. You should see the following screen:
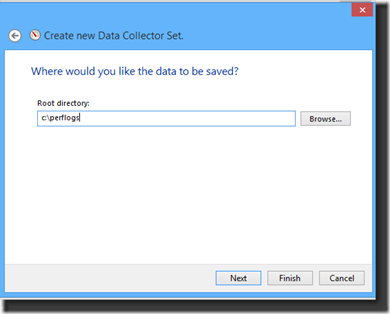
12. Click next and choose a root directory for the trace. In this example I use C:\perflogs:
13. Click finish. You should see a new Event Trace Session that is stopped. In this example it is called Storport.
14. Right-click the new Event Trace Session and click Start to start it:
15. You should now see your new Event Trace Session started:
16. After you are done collecting data, right-click the running Storport trace and select “Stop”.
DECIPHERING TRACE DATA
Now that we have a Storport trace, let’s look at the data it contains. A simple way to see the data is via Event Viewer:
1. Hit the Windows key, type “eventvwr.exe” and hit the enter key. The Event Viewer utility will start:
2. Right-Click on Event Viewer (local) and click on “Open Saved Log”:
3. Choose the directory the Storport trace was saved to, highlight the ETL files and click Open. In this example, we chose c:\perflogs.
4. After clicking “Open” a dialogue box will appear asking to create a new event log copy. Click “Yes”.
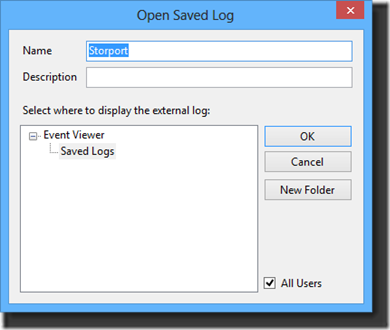
5. You will see the following screen. We left the settings as the default and clicked “OK”.
6. After clicking OK you will see Event ID 223 messages:
7. Let’s look at the detail of the data:
Port: This is the adapter port number (e.g. RaidPort1, etc.)
Bus: This is Bus number
Target: Target ID of the LUN exposed to the Operating System
LUN: Logical Unit Number of the physical storage
RequestDuration: How long the IRP took in 100 nanoseconds increments. To convert to milliseconds, divide this number by 10,000.
CDBLenth: Length of Command Descriptor Block
CDB: Command Descriptor Block (the SCSI command is the first byte of the CDB). If you wish to look up the SCSI command see https://en.wikipedia.org/wiki/SCSI_command
SrbStatus: Status Request Block status returned from the adapter (see srb.h and scsi.h in the Microsoft WDK or https://en.wikipedia.org/wiki/SCSI_Status_Code)
Irp: I/O request packet
OriginalIrp: original I/O request packet
CLOSING THOUGHTS
When troubleshooting disk performance issues, Storport traces capture data from the last layer of software in Windows that an I/O Request Packet (IRP) will pass through before being handed off to hardware. It is an excellent tool for checking if slow disk performance is hardware related.
In a next blog post, I will show a way to look at Storport data via Excel Spreadsheets with Pivot Tables and Pivot Charts. You can look at millions of rows of data if you use the free PowerPivot add-on available with Office 2010 and Office 2013.
Paul Reynolds
Support Escalation Engineer
Windows Core Support Team
Comments
- Anonymous
November 28, 2016
Server 2012R2step10 - select IO_Performanceor can use logman trace on {C4636A1E-7986-4646-BF10-7BC3B4A76E8E} - Anonymous
December 01, 2016
Correctionfor 2012R2 see https://blogs.technet.microsoft.com/askcore/2013/04/25/tracing-with-storport-in-windows-2012-and-windows-8-with-kb2819476-hotfix/as that mentions using IO_Performance


