Chart legend - change item text in a paginated report (Report Builder)
Applies to:
Microsoft Report Builder (SSRS)
Power BI Report Builder
Report Designer in SQL Server Data Tools
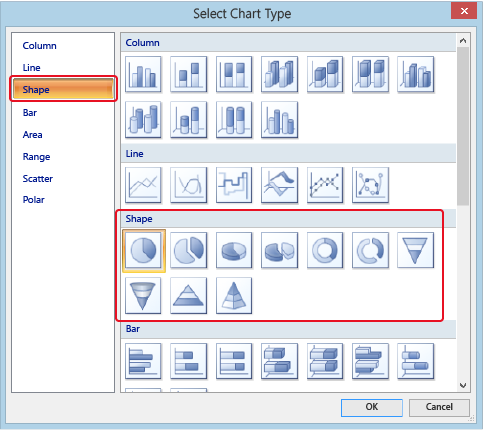
When a field is placed in the Values area of the paginated report chart, a legend item is automatically generated that contains the name of this field. Every legend item is connected to an individual series on the chart, with the exception of shape charts, where the legend is connected to individual data points instead of individual series.
On shape charts, you can change the text of a legend item to show more information about the individual data points. For example, if you want to show the values of the data points as percentages in the legend, you can use a keyword such as #PERCENT. You can append .NET Framework format codes in conjunction with keywords to apply numeric and date formats. For more information about keywords, see Formatting Data Points on a Chart (Report Builder and SSRS).

On non-shape charts, you can change the text of a legend item. For example, if your series name is "Series1", you may want to change the text to something more descriptive like "Sales for 2008".
Note
You can create and modify paginated report definition (.rdl) files in Microsoft Report Builder, Power BI Report Builder, and in Report Designer in SQL Server Data Tools.
To modify the text that appears in the legend on a Shape chart
Right-click on a series, or right-click on a field in the Values area, and select Series Properties.
Click Legend and in the Custom legend text box, type a keyword.
The following table provides examples of chart-specific keywords to use for the Custom Legend Text property. For more information about keywords, see Formatting Data Points on a Chart (Report Builder and SSRS).
| Keyword | Description | Example of what appears as text in the legend |
|---|---|---|
#PERCENT{P1} |
Displays the percentage of the total value to one decimal place. | 85.0% |
#VALY |
Displays the actual numeric value of the data field. | 17000 |
#VALY{C2} |
Displays the actual numeric value of the data field as a currency to two decimal places. | $17000.00 |
#AXISLABEL (#PERCENT{P0}) |
Displays the text representation of the category field, followed by the percentage that each category displays on the chart. | Michael Blythe (85%) |
Note
The #AXISLABEL keyword can only be evaluated at run time when there is not a field specified in the Series Groups area.
To modify the text that appears in the legend on a non-Shape chart
Right-click on a series, or right-click on a field in the Values area, and select Series Properties.
Click Legend and in the Custom legend text box, type a legend label. The series is updated with your text.