Xamarin Profiler Troubleshooting
Logging and Diagnostics
The Xamarin team can help track issues if you provide us with information, including:
- A Screencast of the problem, crash, or failure and your workflow leading up to it.
- Log outputs (see below).
- The .mlpd being generated for the profiling session (see below).
Getting Log Outputs
On Mac logs are saved to ~/Library/Logs/Xamarin.Profiler/Profiler.<date>.log.
On Windows these are saved to %appdata%Local//Xamarin/Log/Xamarin.Profiler/Profiler.<date>.log Please include the latest log whenever you submit an issue.
We’re adding more logging as we go, so this output should grow and become more useful over time.
Generating .mlpd Files
An .mlpd file is the compressed output of the mono runtime profiler. The Xamarin Profiler GUI reads the data from an .mlpd and displays it for the user. .mlpd files are useful debugging tools for Xamarin because they help our engineers diagnose problems the Profiler might be having with your data.
The .mlpd for the current session is automatically saved in your Mac’s /tmp directory, and can be identified by the timestamp. If you turn on logging, the first output will be the path to the .mlpd file. The .mlpd file will normally be saved in the directory starting ~/var/folders…
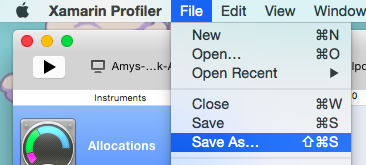
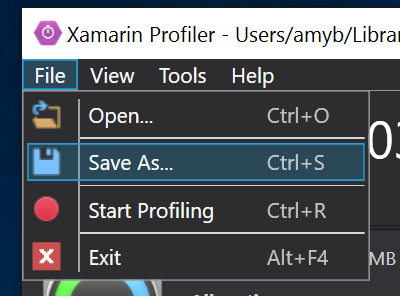
The .mlpd for a current session can also be saved by choosing File > Save As… from the Profiler’s menu:
Visual Studio for Mac:

Visual Studio:

It is important to note that .mlpd contain a lot of information, and the file size will be large.
Troubleshooting
The list below shows common gotchas, workarounds, and tips and tricks for using the Profiler.
Note
You need to be a Visual Studio Enterprise subscriber to unlock this feature in either Visual Studio Enterprise on Windows or Visual Studio for Mac.
I can't see the iOS profiler option, or it is greyed out [Visual Studio and Visual Studio for Mac]
Check the following settings to resolve this:
- Ensure that you are using the Debug configuration
- Ensure that you are using the SGen Garbage collector.
- Ensure the Platform is supported.
- Ensure that you have the right license.
- Ensure that you are logged in and properly authenticated.
- [Visual Studio] You must be using Visual Studio Enterprise and have a valid Enterprise license.
I get an error when I try to launch the profiler
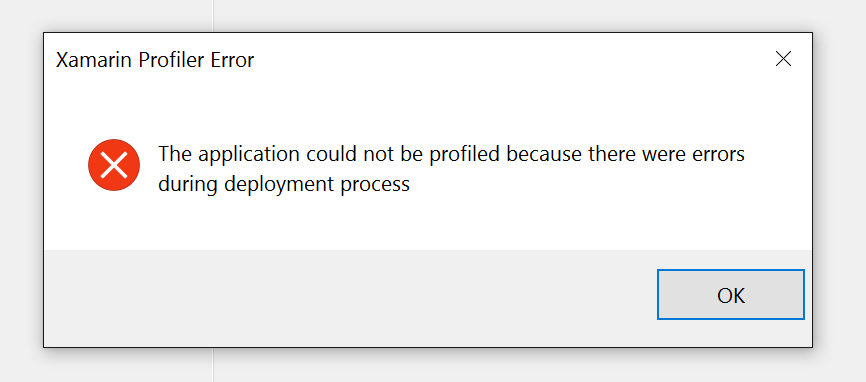
If you run into this error box when using the profiler in Visual Studio :

It is normally due to being unable to launch to the Simulator / Emulator. Try and run the app normally, fix the issues that it gives, and then try to use the Profiler again.
To watch a specific thread
If you have a thread that you wanted to specifically watch, it would be ideal to name the thread at the very beginning of its creation to get ThreadName instead of 0x0. For example to set the thread name as UI, you could use the following code:
RunOnUiThread (() => {
  Thread.CurrentThread.Name  = "UI";
});