Debugging Xamarin.iOS Apps
Xamarin.iOS applications can be debugged with the built-in debugger in Visual Studio for Mac or Visual Studio.
Use Visual Studio for Mac's native debugging support for debugging C# and other managed languages code and use LLDB when you need to debug C, C++ or Objective C codethat you might be linking with your Xamarin.iOS project.
Note
When you compile applications in Debug mode, Xamarin.iOS will generate slower and much larger applications as every line of code must be instrumented. Before releasing, make sure that you do a Release build.
The Xamarin.iOS debugger is integrated into your IDE and it allows developers to debug Xamarin.iOS applications built with any of the managed languages supported by Xamarin.iOS in the simulator and on the device.
The Xamarin.iOS debugger uses the Mono Soft Debugger, which means that the generated code and the Mono runtime cooperate with the IDE to provide a debugging experience. This is different than hard debuggers like LLDB or MDB which control a program without the knowledge or cooperation from the debugged program.
Setting Breakpoints
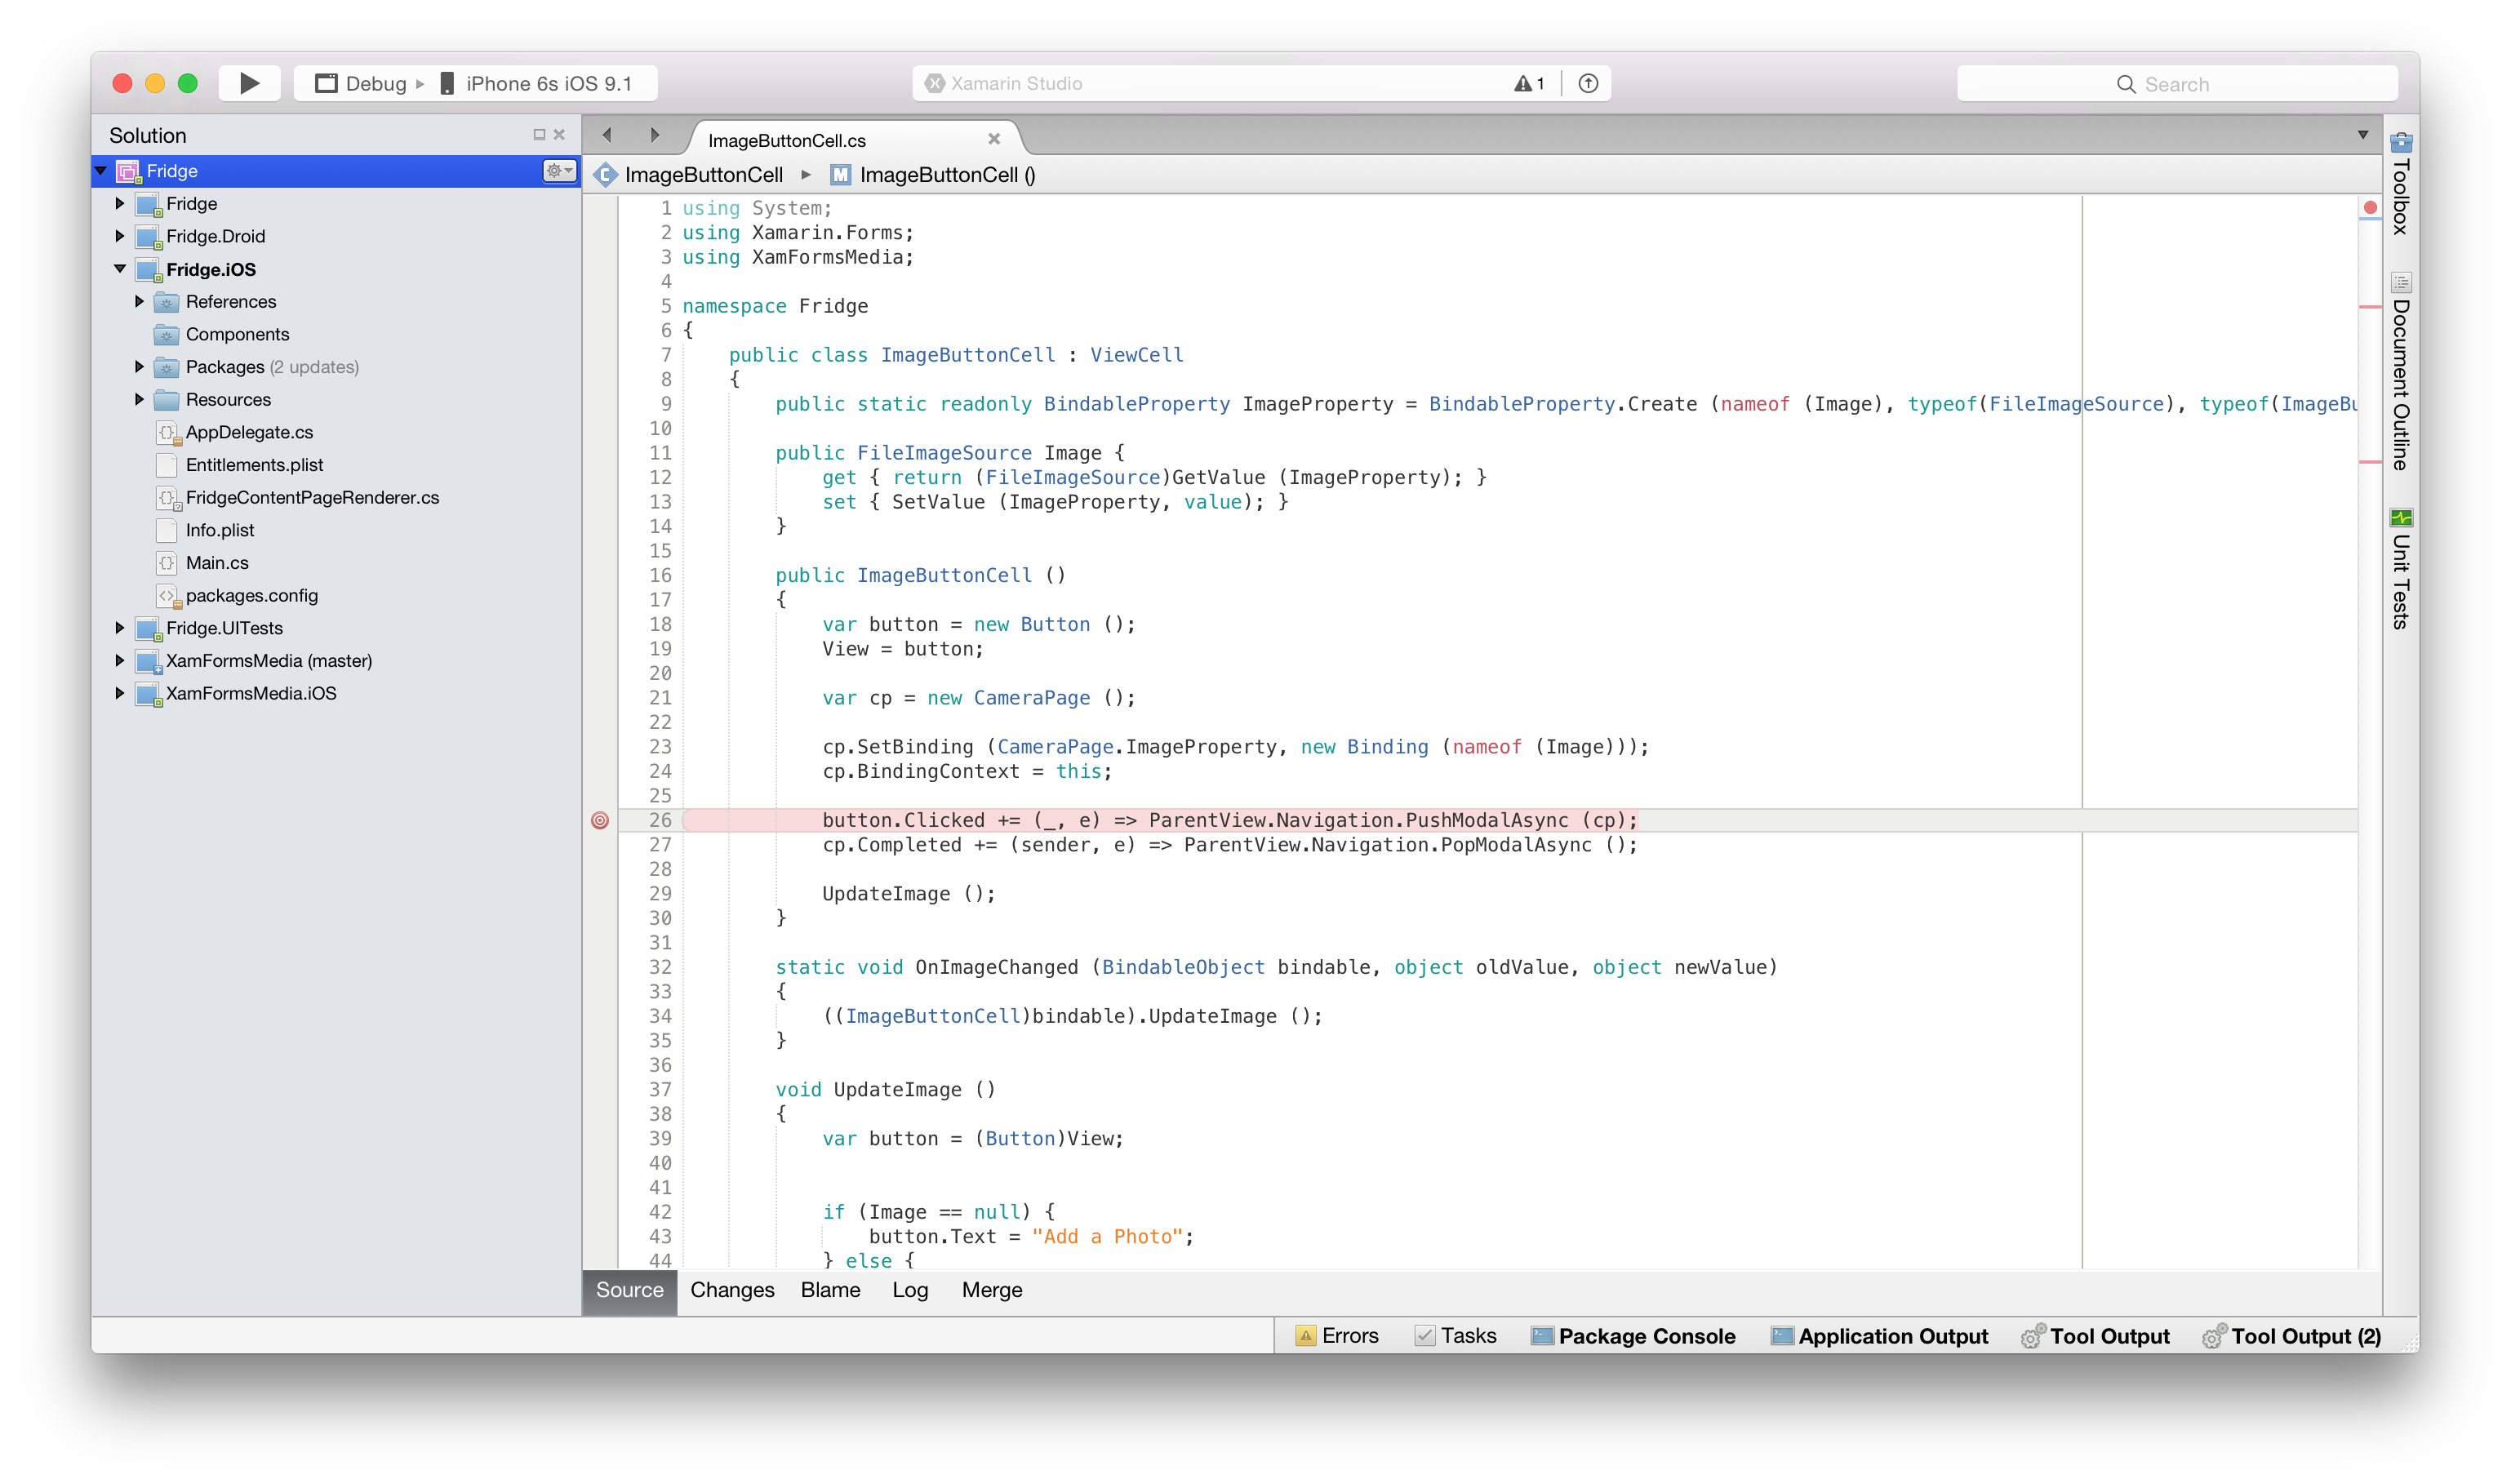
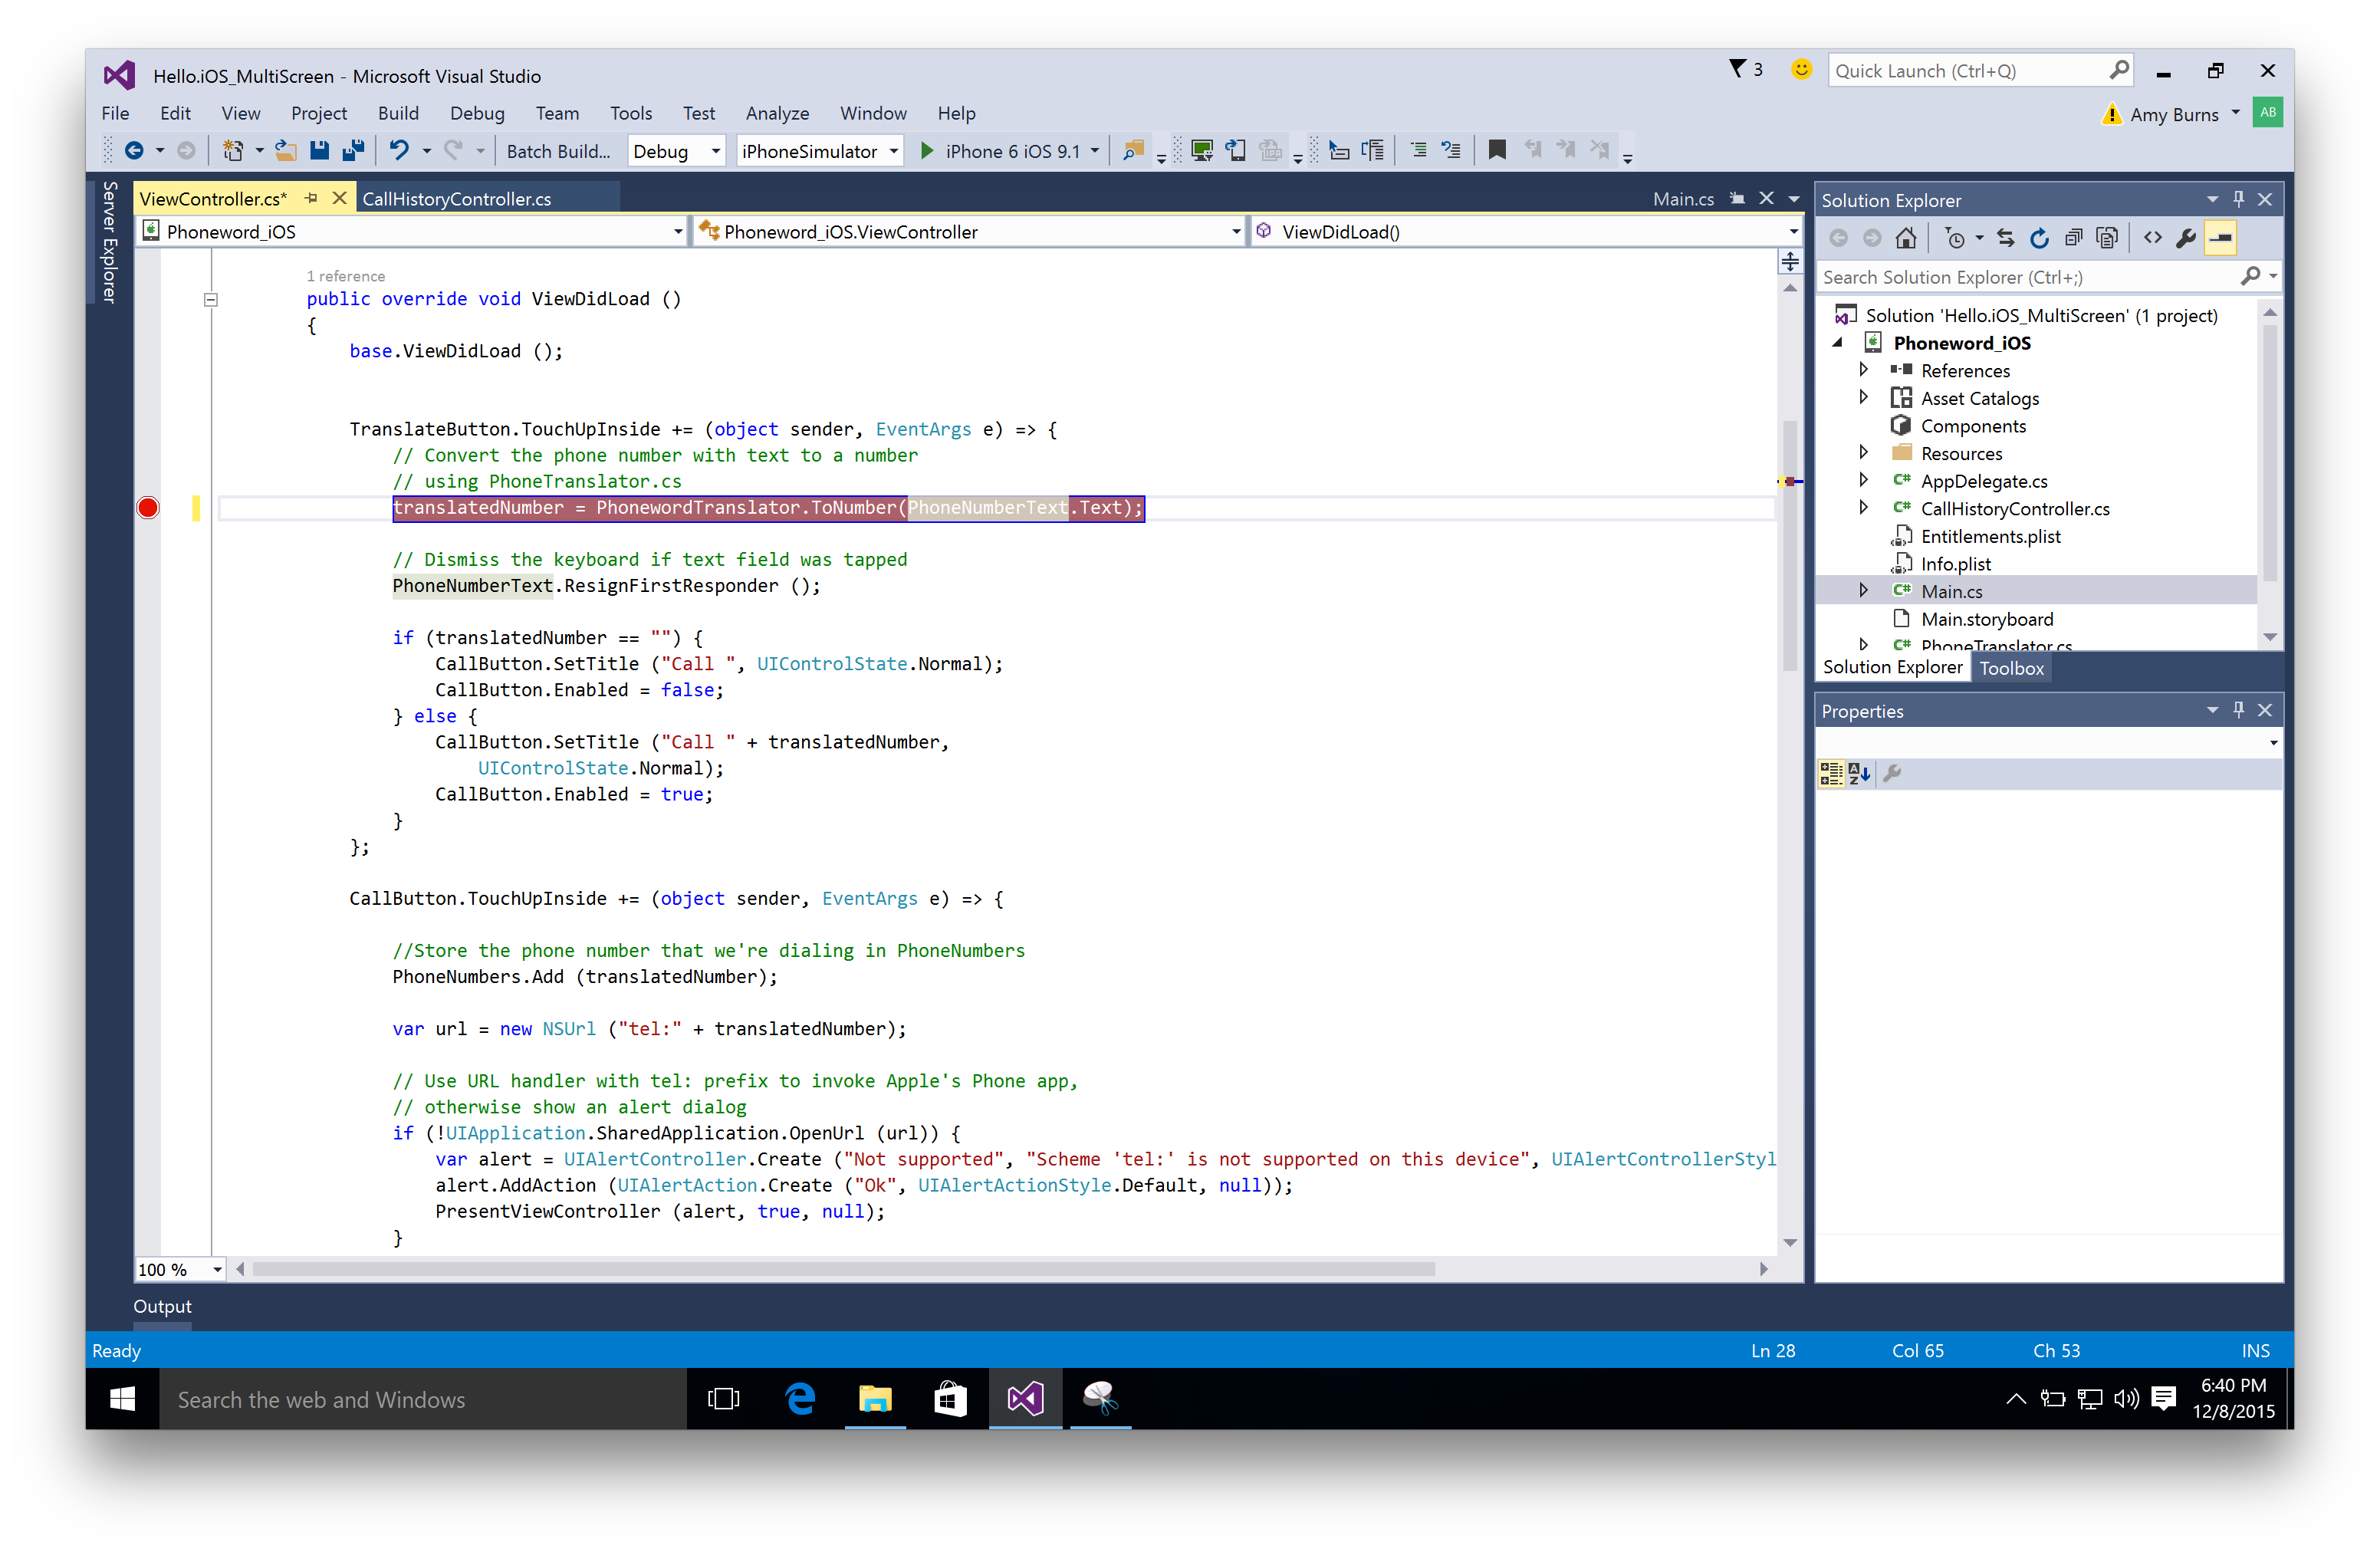
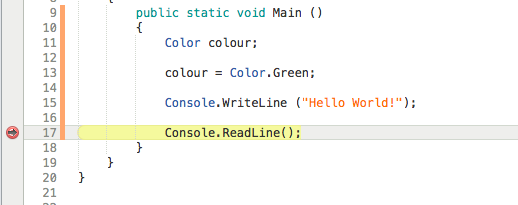
When you are ready to start debugging your application the first step is to set breakpoints your application. This is done by clicking in the margin area of the editor, next to the line number of code you want to break at:
You can view all the breakpoints that have been set in your code by going to the Breakpoints pad:
If the Breakpoints pad does not display automatically, you can make it visible by selecting View > Debug Windows > Breakpoints
Before you begin debugging any application, always ensure that the configuration is set to Debug, as this contains a helpful set of tools to support debugging such as breakpoints, using data visualizers, and viewing the call stack:
Start Debugging
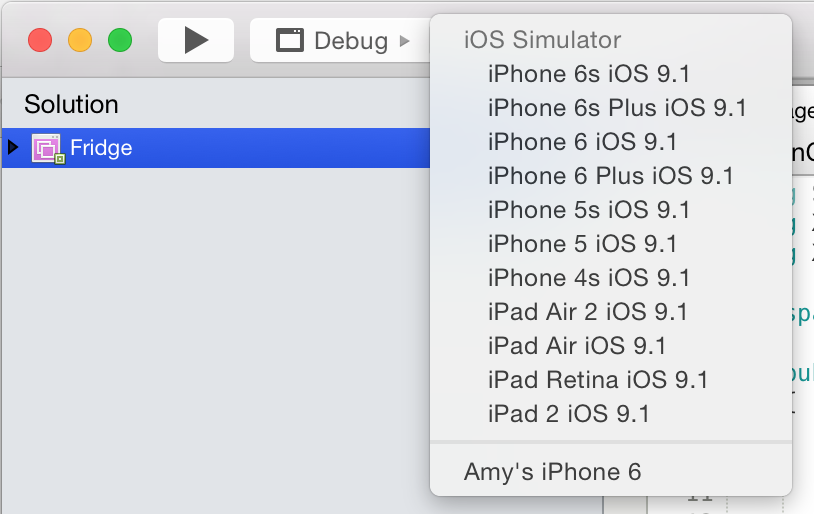
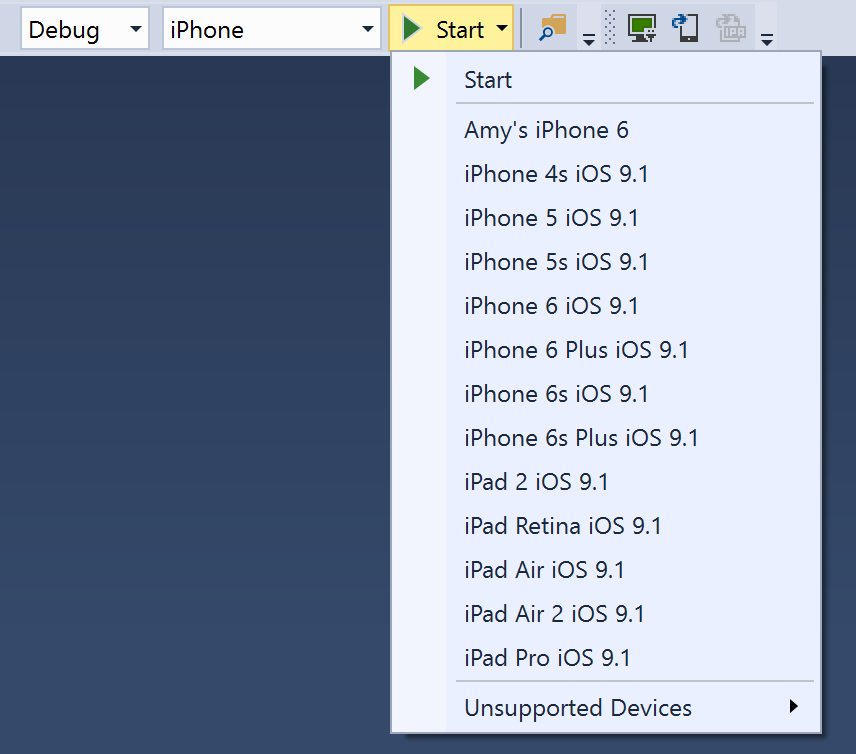
To start debugging, select the target device or similar in your IDE:
Then deploy your application by pressing the Play button.
When you hit a breakpoint, the code will be highlighted yellow:
Debugging tools, such as inspecting the values of objects, can be used at this point to get more information about what is happening in your code:
Conditional Breakpoints
You can also set rules dictating the circumstances under which a breakpoint should occur, this is know as adding a conditional breakpoint.
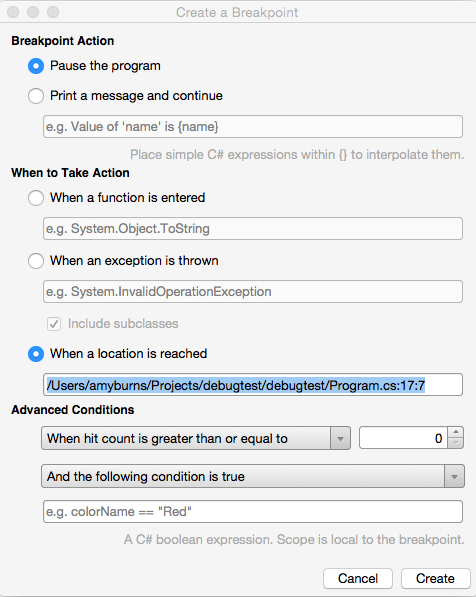
To set a conditional breakpoint, access the Breakpoint Properties window, which can be done in two ways:
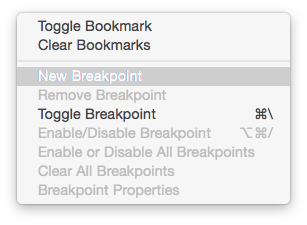
To add a new conditional breakpoint, right-click on the editor margin, to the left of the line number for the code you wish to set a breakpoint on, and select New Breakpoint:
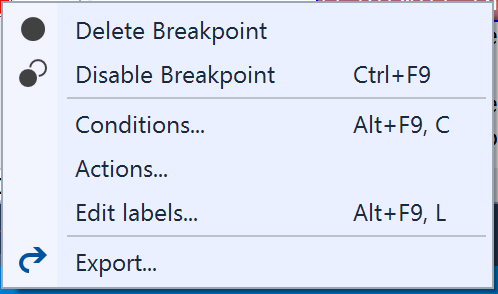
To add a condition to an existing breakpoint, right-click on the breakpoint and select Breakpoint Properties or in the Breakpoints Pad select the properties button illustrated below:
You can then enter the condition under which you want to breakpoint to occur:
Navigating through code
When a breakpoint has been reached, the Debug tools enable you to get control over the program’s execution. The IDE will display four buttons, allowing you to run and step through the code.
In Visual Studio for Mac they will look like the following:
These are:
- Play/Stop – This will begin/stop executing the code, until the next breakpoint.
- Step Over – This will execute the next line of code. If the next line is a function call, step over will execute the function, and will stop at the next line of code after the function.
- Step Into – This will also execute the next line of code. If the next line is a function call, Step Into will stop at the first line of the function, allowing you to continue line-by-line debugging of the function. If the next line is not a function, it will behave the same as Step Over.
- Step Out – This will return to the line where the current function was called.
Breakpoints
It is important to point out that the iOS gives
applications only a handful of seconds (10) to startup and complete the
FinishedLaunching method in the Application delegate. If the application does
not complete this method in 10 seconds, then iOS will kill the process.
This means that it is almost impossible to set breakpoints on the startup code of your program. If you want to debug your startup code, you should delay some of its initialization and put that into a timer-invoked method, or in some other form of callback method that is executed after FinishedLaunching has terminated.
Device Diagnostics
If there is an error setting up the debugger, you can enable detailed diagnostics by adding "-v -v -v" to the additional mtouch arguments in your Project Options. This will print detailed error information to the device console.
Wireless Debugging
The default in Xamarin.iOS is to debug your application on your devices over the USB connection. Sometimes the USB device might be needed to test plugging/unplugging of the cable for developing ExternalAccessory-powered applications. In those cases, you can use debugging over the wireless network.
For more information on Wireless Deployment and Debugging, refer to the Wireless Deployment guide.
Technical Details
Xamarin.iOS uses the new Mono soft debugger. Unlike the standard Mono debugger which is a program that controls a separate process by using operating system interfaces to control a separate process, the soft debugger works by having the Mono runtime expose the debugging functionality through a wire protocol.
On startup, an application that is to be debugged contacts the debugger and the debugger starts to operate. In Xamarin.iOS for Visual Studio, the Xamarin Mac Agent acts as the middle-man between the application (in Visual Studio) and the debugger.
This soft debugger requires a cooperative debugging scheme when running on the device. This means that your binary builds when debugging will be larger as the code is instrumented to contain extra code at every sequence point to support debugging.
Accessing the Console
Crash logs and the output of the Console class will be sent to the iPhone console. You can access this console with Xcode using the "Organizer" and selecting your device from the organizer.
Alternatively, if you do not want to start up Xcode, you can use the Apple's iPhone Configuration Utility to directly access the console. This has the added bonus that you can access the console logs from a Windows machine if you are debugging a problem in the field.
For Visual Studio users, there are a few logs available in the Output window, but you should switch over to your Mac for more thorough and detailed logs.
Debugging Mono's Class Libraries
Xamarin.iOS ships with the source code for Mono's class libraries, and you can use this to single step from the debugger to see how things are working under the hood.
Since this feature consumes more memory during debugging, this is turned off by default.
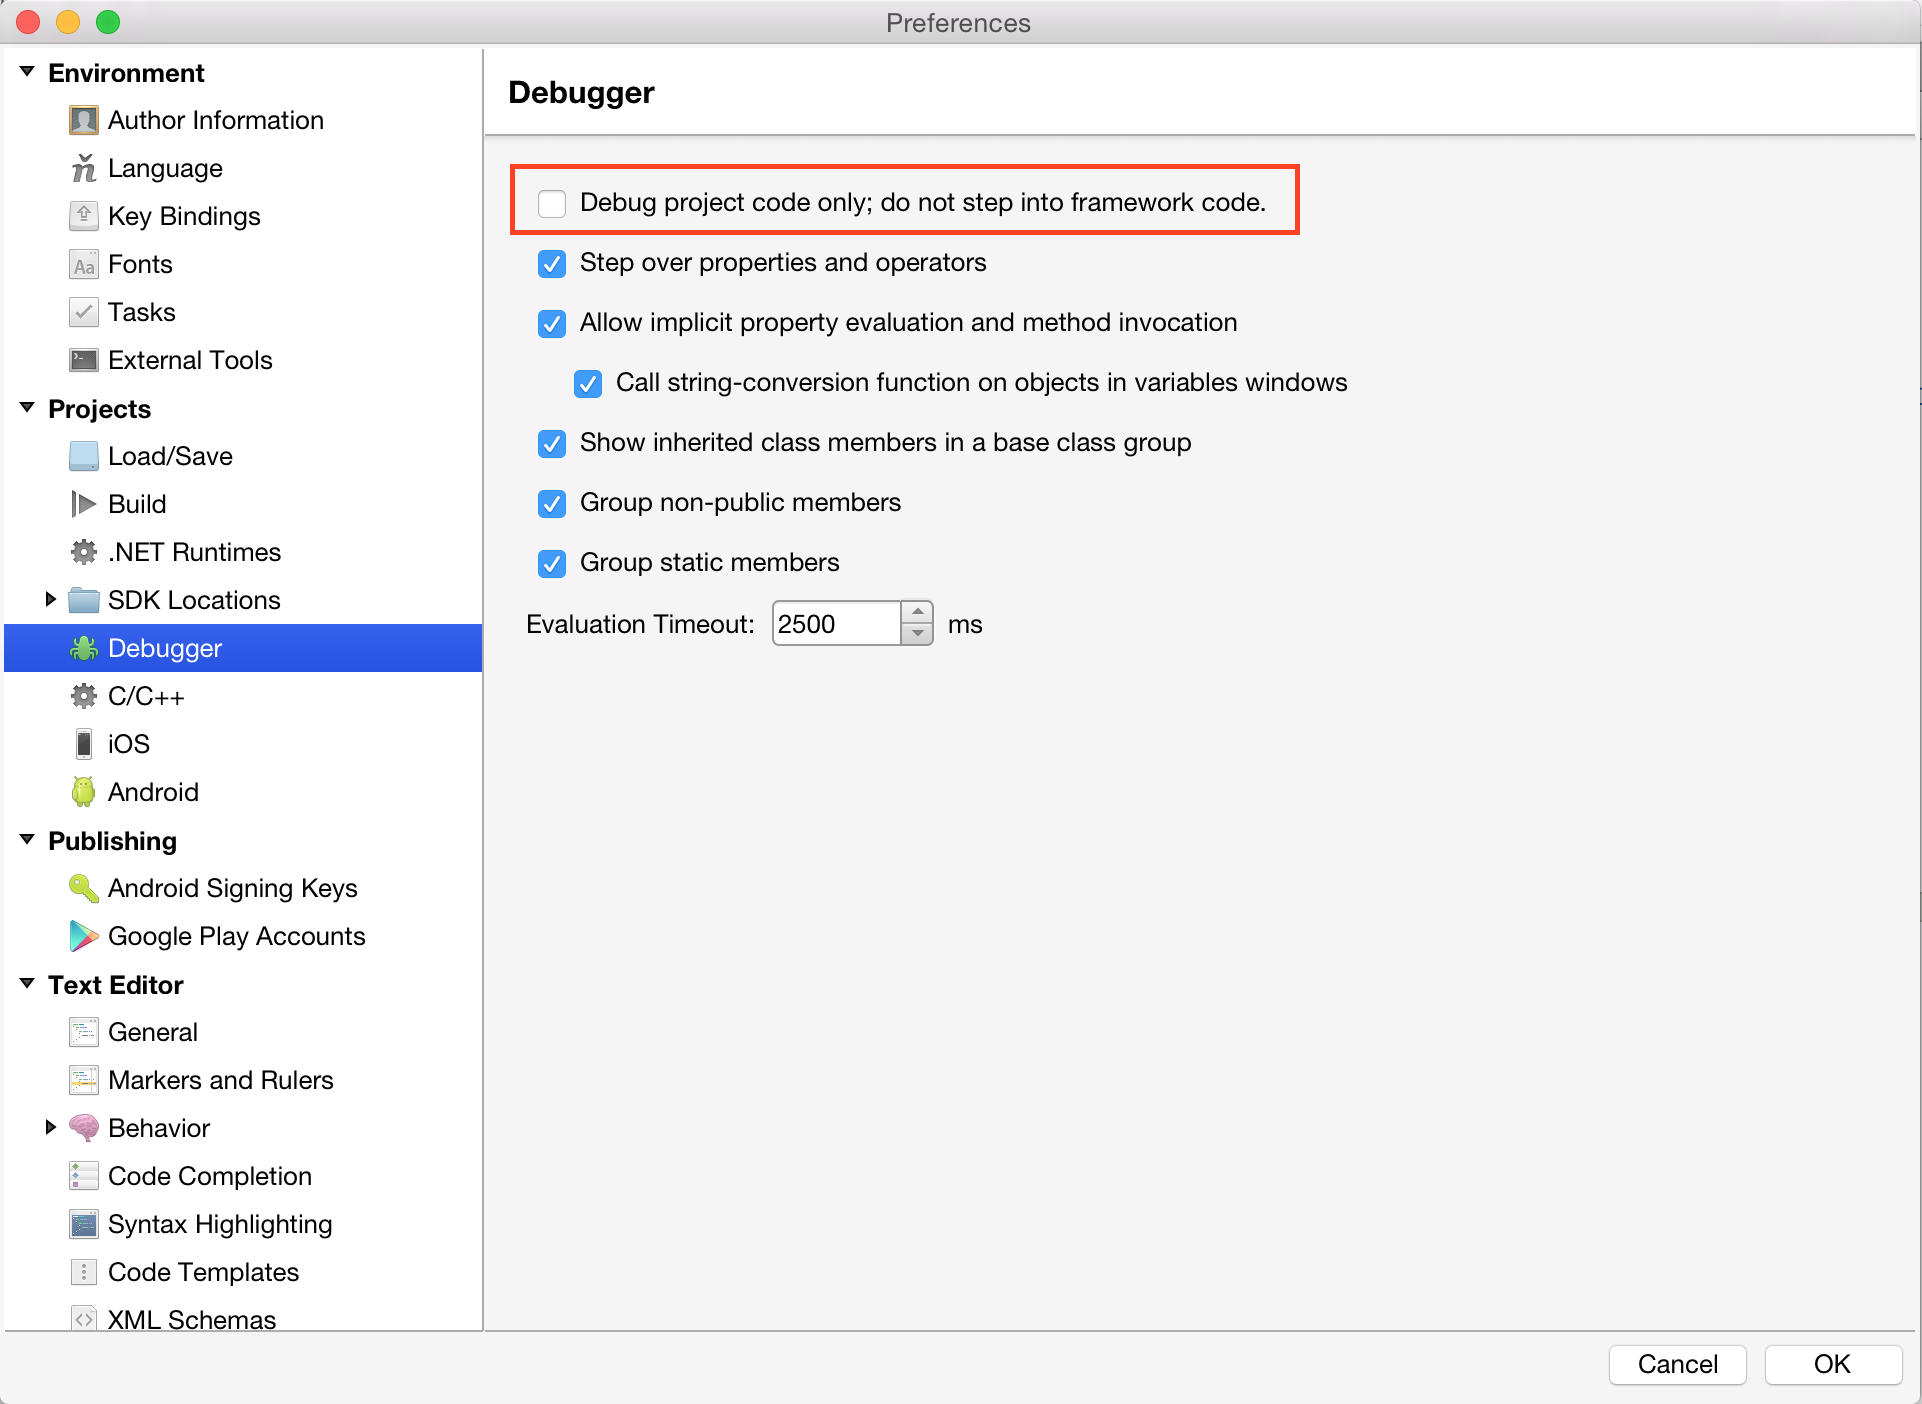
To enable this feature, make sure the Debug project code only; do not step into framework code option is deselected under the Visual Studio for Mac > Preferences > Debugger menu as illustrated below:
Once you do this, you can start your application and single step into any of Mono's core class libraries.
