Monitor the CMG
Applies to: Configuration Manager (current branch)
After the cloud management gateway (CMG) is running and clients are connecting through it, you can monitor clients and network traffic. Monitor the service to make sure its performance is optimal.
Monitor clients
Clients connected through the CMG appear in the Configuration Manager console the same way on-premises clients do. For more information, see how to monitor clients.
Monitor traffic in the console
Monitor traffic on the CMG using the Configuration Manager console:
Go to the Administration workspace, expand Cloud Services, and select the Cloud Management Gateway node.
Select the CMG in the list pane.
View the traffic information in the details pane for the CMG connection point and the site system roles it connects to. These statistics show the client requests coming into these roles. The requests include policy, location, registration, content, inventory, and client notifications.
Monitor content
Monitor content that you distribute to a CMG the same as with any other distribution point. For more information, see Monitor content.
When you view the list of CMGs in the console, you can add more columns to the list. For example, the Storage egress (GB) column shows the amount of data that clients downloaded from the service in the last 30 days.
Monitor logs
The following table lists the log files that contain information related to the cloud management gateway.
| Log name | Description | Computer with log file |
|---|---|---|
| CloudMgr.log | Records details about deploying the cloud management gateway service, ongoing service status, and use data associated with the service. To configure the logging level, edit the Logging level value in the following registry key: HKLM\SOFTWARE\ Microsoft\SMS\COMPONENTS\ SMS_CLOUD_ SERVICES_MANAGER |
The installdir folder on the primary site server or CAS. |
| CMGSetup.log Note 1 | Records details about the second phase of the cloud management gateway deployment (local deployment in Azure). To configure the logging level, use the setting Trace level (Information (Default), Verbose, Error) on the Azure portal\Cloud services configuration tab. | The %approot%\logs on your Azure server, or the SMS/Logs folder on the site system server |
| CMGService.log Note 1 | Records details about the cloud management gateway service core component in Azure. To configure the logging level, use the setting Trace level (Information (Default), Verbose, Error) on the Azure portal\Cloud services configuration tab. | The %approot%\logs on your Azure server, or the SMS/Logs folder on the site system server |
| SMS_Cloud_ProxyConnector.log | Records details about setting up connections between the cloud management gateway service and the cloud management gateway connection point. | Site system server |
| CMGContentService.log Note 1 | When you enable a CMG to also serve content from Azure storage, this log records the details of that service. | The %approot%\logs on your Azure server, or the SMS/Logs folder on the site system server |
- For troubleshooting deployments, use CloudMgr.log and CMGSetup.log
- For troubleshooting service health, use CMGService.log and SMS_Cloud_ProxyConnector.log.
- For troubleshooting client traffic, use CMGService.log and SMS_Cloud_ProxyConnector.log.
Note 1: Logs synchronized from Azure
These are local Configuration Manager log files that cloud service manager syncs from Azure storage every five minutes. The cloud management gateway pushes logs to Azure storage every five minutes. So the maximum delay is 10 minutes. Verbose switches affect both local and remote logs. The actual file names include the service name and role instance identifier. For example, CMG-ServiceName-RoleInstanceID-CMGSetup.log. These log files are synced, so you don't need to RDP to the cloud management gateway to obtain them, and that option isn't supported.
Cloud management dashboard
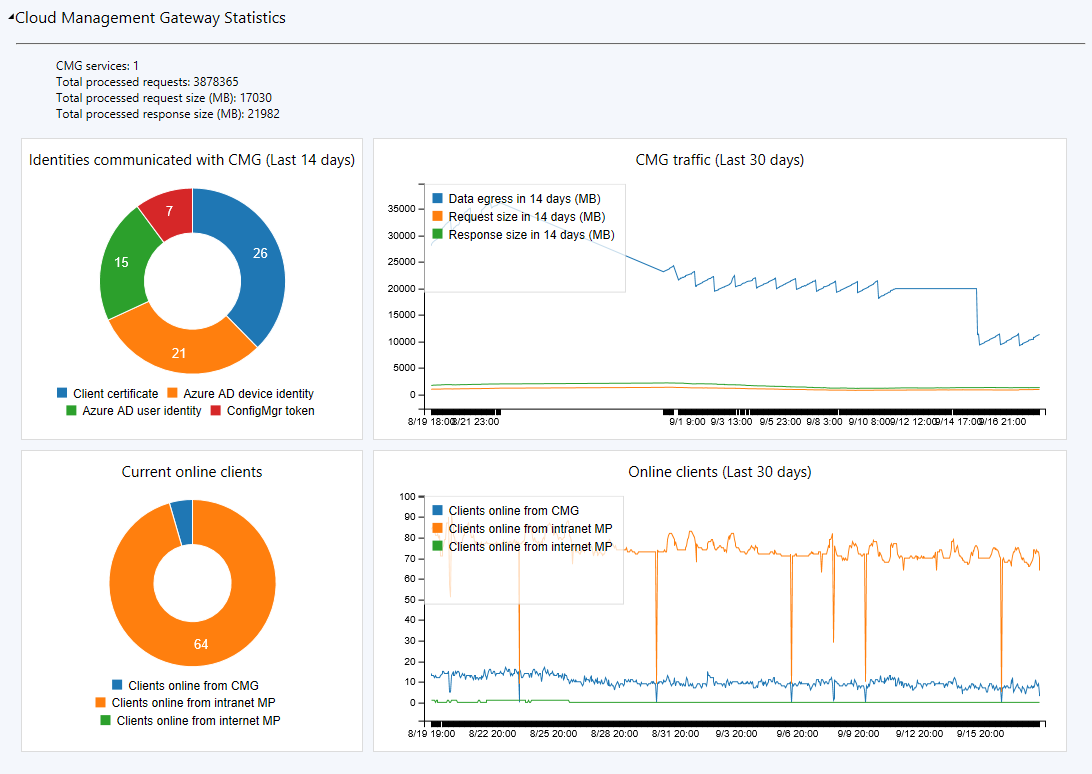
The cloud management dashboard provides a centralized view for CMG usage. It also displays data about cloud users and devices.
In the Configuration Manager console, go to the Monitoring workspace. Select the Cloud Management node, and view the dashboard tiles.
The following screenshot shows the section of the cloud management dashboard specific for the CMG:
Connection analyzer
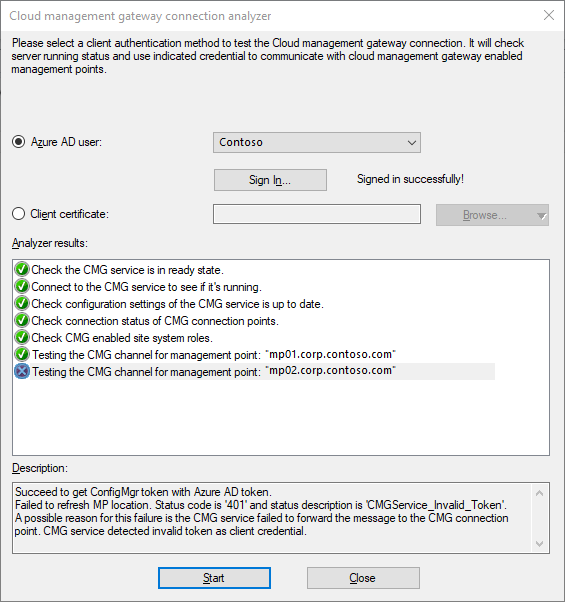
To aid troubleshooting, use the CMG connection analyzer for real-time verification. The in-console utility checks the current status of the service, and the communication channel through the CMG connection point to any management points that allow CMG traffic.
In the Configuration Manager console, go to the Administration workspace. Expand Cloud Services and select the Cloud management gateway node.
Select the target CMG instance, and then select Connection analyzer in the ribbon.
In the CMG connection analyzer window, select one of the following options to authenticate with the service:
Microsoft Entra user: Use this option to simulate communication the same as a cloud-based user identity signed in to a Microsoft Entra joined Windows device. Select Sign In to securely enter the credentials for a Microsoft Entra user account.
Client certificate: Use this option to simulate communication the same as a Configuration Manager client with a client authentication certificate.
Select Start to start the analysis. The analyzer window displays the results. Select an entry to see more details in the Description field.

Set up outbound traffic alerts
Outbound traffic alerts help you know when network traffic approaches a 14-day threshold level. When you create the CMG, you can set up traffic alerts. If you skipped that part, you can still set up the alerts after the service is running. Adjust the alert settings at any time.
You can also configure thresholds for the amount of data that you want to store on the CMG and that clients download. Use alerts for these thresholds to help you decide when to stop or delete the cloud service, adjust the content that you store on the CMG, or modify which clients can use the service.
Go to the Administration workspace, expand Cloud Services, and select the Cloud Management Gateway node.
Select the CMG in the list pane, and then select Properties in the ribbon.
Go to the Alerts tab to enable the threshold and alerts:
Specify the 14-day data threshold for outbound data transfer in gigabytes (GB). This threshold helps you to monitor the amount of data that transfers from the CMG to clients every two weeks. By default, this threshold is approximately 10 TB. The default value is
10,000GB. The site raises warning and critical alerts when transfers reach values that you define. By default, these alerts occur at 50% and 90% of the threshold.If the CMG is content-enabled, also specify a storage alert threshold. This threshold sets an upper limit on the amount of content to store on the CMG. By default, this threshold is approximately 2 TB. The default value is
2,000GB. Configuration Manager generates warning and critical alerts when the remaining free space reaches the levels that you specify. By default, these alerts occur at 50% and 90% of the threshold.
Note
Alerts for the CMG depend on usage statistics from Azure, which can take up to 24 hours to become available. For more information about Storage Analytics for Azure, see Storage Analytics.
In an hourly cycle, the primary site that monitors the CMG downloads transaction data from Azure. It stores this transaction data in the CloudDP-<ServiceName>.log file on the site server. Configuration Manager then evaluates this information against the storage and transfer quotas for each CMG. When the transfer of data reaches or exceeds the specified volume for either warnings or critical alerts, Configuration Manager generates the appropriate alert.
Because the site downloads information about data transfers from Azure every hour, the usage might exceed a warning or critical threshold before Configuration Manager can access the data and raise an alert.
Stop CMG when it exceeds threshold
Configuration Manager can stop a CMG service when the total data transfer goes over your limit. Use alerts to trigger notifications when the usage reaches warning or critical levels. To help reduce any unexpected Azure costs because of a spike in usage, this option turns off the cloud service.
Important
Even if the service isn't running, there are still costs associated with the cloud service. Stopping the service doesn't eliminate all associated Azure costs. To remove all cost for the cloud service, delete the CMG.
When you stop the CMG service, internet-based clients can't communicate with Configuration Manager.
The total data transfer (egress) includes data from the cloud service and storage account. This data comes from the following flows:
- CMG to client
- CMG to site, including CMG log files
- If you enable CMG for content, storage account to client
For more information on these data flows, see CMG ports and data flow.
The storage alert threshold is separate. That alert monitors the capacity of your Azure storage instance.
When you select the CMG instance in the Cloud Management Gateway node in the console, you can see the total data transfer in the details pane.
Configuration Manager checks the threshold value every six minutes. If there's a sudden spike in usage, Configuration Manager can take up to six minutes to detect that it exceeded the threshold and then stop the service.
Process to stop the cloud service when it exceeds threshold
On the Alerts tab of the CMG properties window, enable the option to Stop this service when the critical threshold is exceeded.
To test this feature, temporarily reduce one of the following values:
14-day threshold for outbound data transfer (GB). The default value is
10000.Percentage of threshold for raising Critical alert. The default value is
90.
Next steps
If you need to change the configuration, you can modify the CMG:
