Monitoring guidelines for Emissions Impact Dashboard
Emissions Impact Dashboard for Azure and Emissions Impact Dashboard for Microsoft 365 are Power BI apps, so monitoring procedures are similar to other Power BI apps you're using.
Centralized monitoring
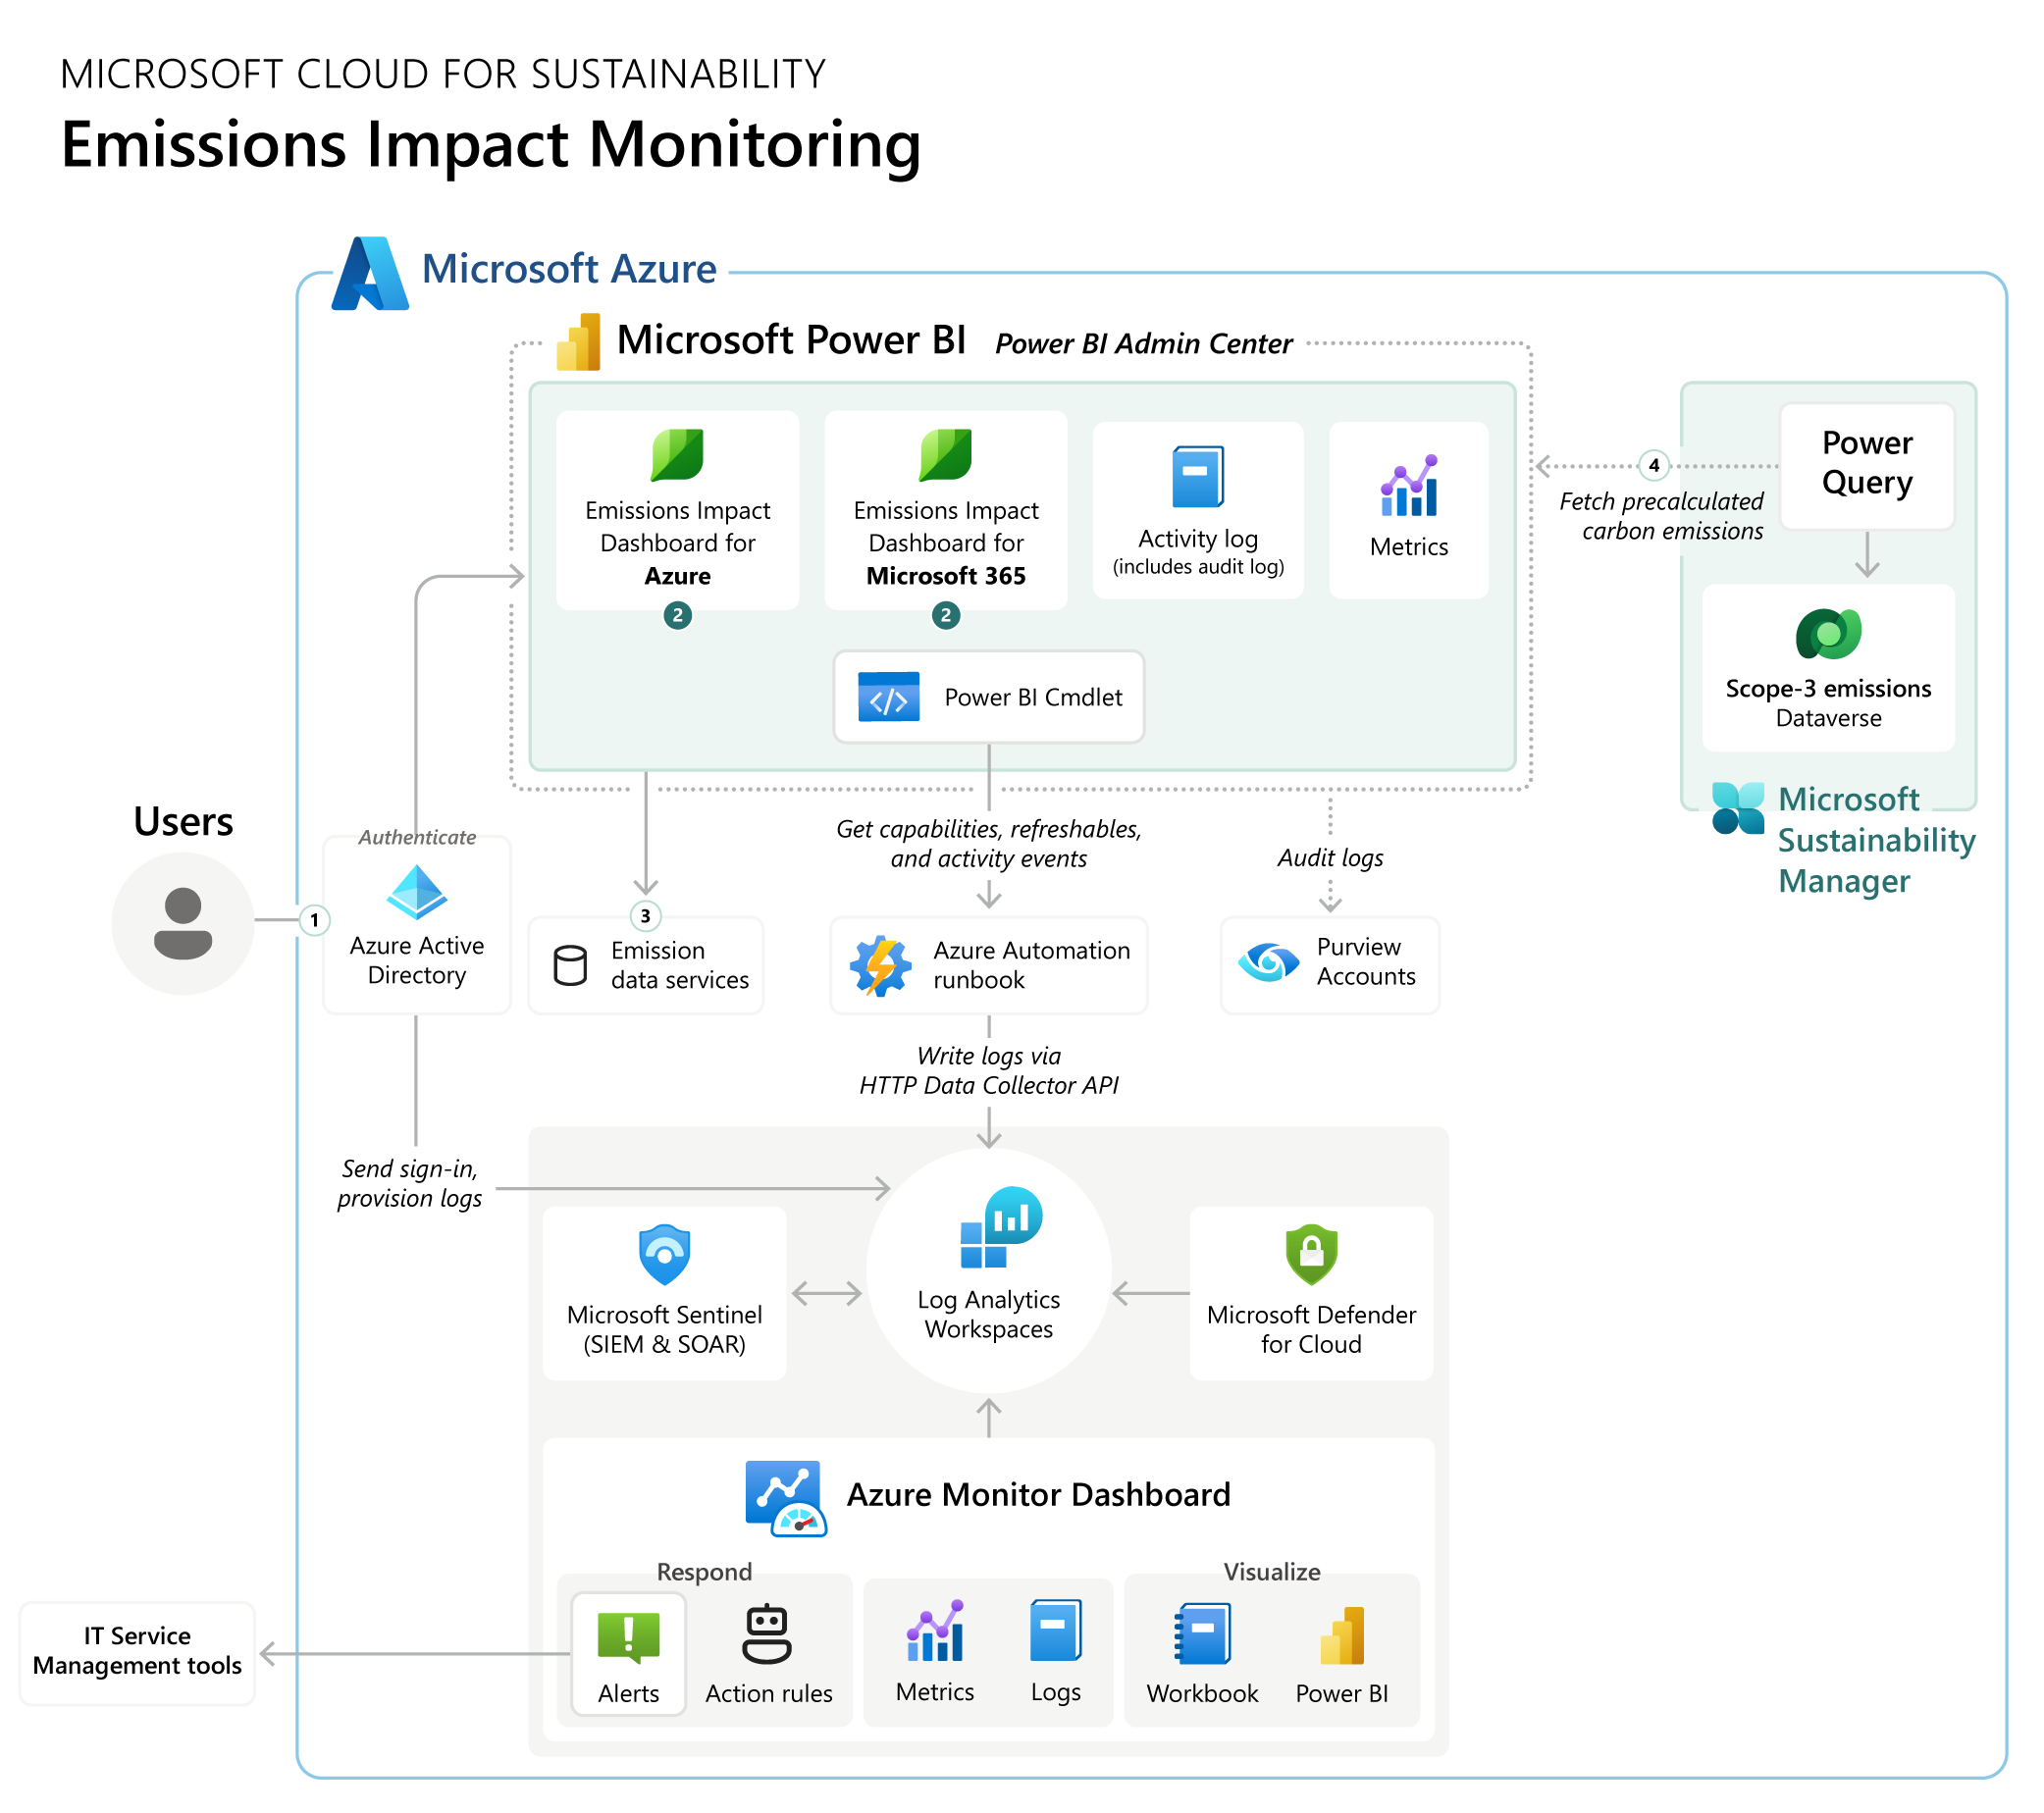
The following diagram is a reference operational monitoring architecture tailored for Emissions Impact Dashboard needs. It includes the following Microsoft tools for centralized monitoring:
- Power BI admin center for usage and data refreshes
- Microsoft Purview for audit monitoring
- Microsoft Defender for Cloud and Microsoft Sentinel for security information and event management (SIEM) and cybersecurity threat monitoring
A custom Azure Automation playbook collects activity logs in Power BI via Power BI SDK. It then transforms and feeds this log into an Azure Log Analytics workspace so that you can use Azure Monitor for monitoring, query, and alert purposes.
Download a printable PDF of the diagram.
The following table presents how each solution component in the diagram generates operational and audit logs, how you can monitor, and how you can define an alert mechanism.
| Solution component | Monitoring | Logging | Auditing | Alert |
|---|---|---|---|---|
| Authentication to Emissions Impact Dashboard | Microsoft Entra ID sign-in logs Send activity logs to Azure Monitor |
Sign-in, provisioning, and audit logs in Microsoft Entra ID | Changes to applications, groups, users, and licenses in Microsoft Entra audit logs | Custom: Azure Monitor SIEM: Microsoft Sentinel Cyber-security: Microsoft Defender |
| Power BI | Usage metrics Power BI admin center Usage monitoring by workspace (preview) Power BI Premium Gen2 capacity performance monitoring using Gen2 metrics app. |
You can access Power BI activity log via API or management Cmdlet. | Power BI audit log (30 days) Microsoft Purview (90 days) |
Custom Azure Monitor alerts from the activity log fed into Log Analytics workspace. |
| Emissions Impact for Azure data provider: Customer enrollment service Emissions Impact for Microsoft 365 data provider: Sustainability calculator service |
Monitoring data flow refresh status | Microsoft managed | Microsoft managed | Microsoft managed |
| Emissions Impact Dashboard ingests precalculated carbon emissions | Data Connections | Each connection refreshes logs into the connection refresh table (msdyn_dataconnectionrefresh) in Dataverse. | Microsoft Purview keeps Power Platform connector activity (preview) event logs | You can develop a custom Power Automate flow to send a notification when Connection refresh table record fails. |
