Gain insights about fundraising performance
Important
Fundraising and Engagement is being retired. Support for Fundraising and Engagement will end at 11:59 PM Pacific Time on December 31, 2026. For more information, go to What’s new in Fundraising and Engagement.
Gain insights about your fundraising programs with the Fundraising performance dashboard in Microsoft Cloud for Nonprofit. The Fundraising performance dashboard lets you explore snapshots of your programs, program revenue and budgets, donations aligned to programs, and other information about your programs. The dashboards are built on the Nonprofit Common Data Model. They're interactive so you can drill down to see key information.
The Fundraising performance dashboard provides you with three views:
This article explains the data behind these pages. For best results, be sure that you've set up campaign goals in Fundraising and Engagement. Without campaign goals, some tiles on the dashboards don't display correctly. The key campaign fields are:
- Estimated revenue
- Total cost of campaign
- Total revenue
Note
Fundraising performance dashboard uses the fiscal year you set up in Fundraising and Engagement. If you haven't configured a fiscal year, the dashboard uses the default fiscal year, January through December.
Each table clearly indicates whether it covers just the fiscal year or includes other years.
The interactivity markers indicate that the tile will filter other visualizations. Not all interactive tiles filter all the visuals on the rest of the page. Select the tile a second time to view all records after filtering.
Donors
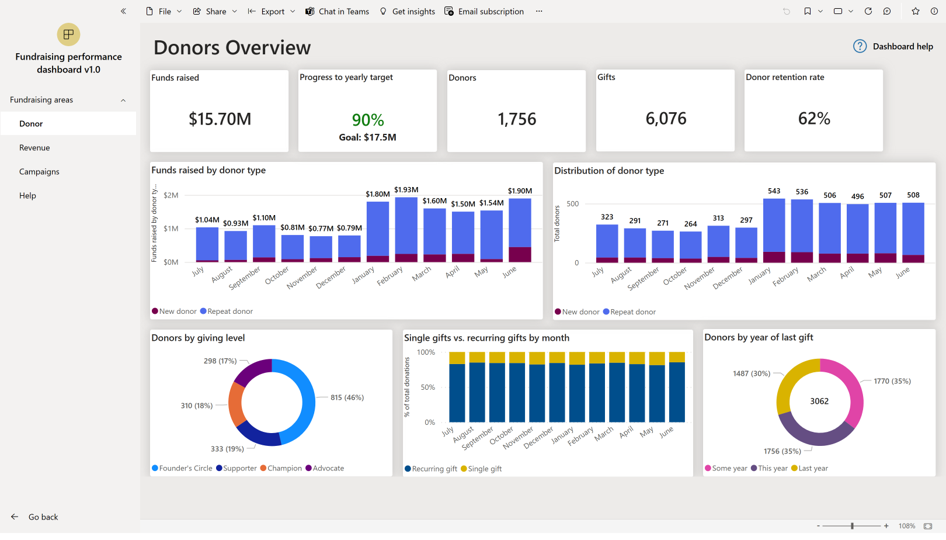
Learn more about your supporters on the Donors page with metrics such as retention and giving level. The Donors page also provides key performance indicator (KPI) card that provides insights about your fundraising performance.

| Tile | Type | Purpose | Table | Interactive | Time period |
|---|---|---|---|---|---|
| Funds raised | Card | Total funds raised from all fundraising activities | msnfp_transaction | No | Fiscal year only |
| Progress to yearly target | Card | Percentage progress towards the yearly fundraising target | goal | No | Fiscal year only |
| Goal | Overlay on card | Fundraising goal for the nonprofit organization | goal | No | Fiscal year only |
| Donors | Card | Total number of donors who donated this fiscal year | msnfp_transaction | No | Fiscal year only |
| Gifts | Card | Total number of gifts made | msnfp_transaction | No | Fiscal year only |
| Donor retention rate | Card | Compares previous active donors to active donors in this fiscal year | donors | No | Current and previous fiscal years |
| Funds raised by donor type | Stacked column chart | Total value of donations split between new and repeat donors | msnfp_transaction | Yes | Fiscal year only |
| Distribution of donor type | Stacked column chart | Total number of donations split between new and repeat donors | msnfp_transaction | Yes | Fiscal year only |
| Donors by giving level | donut chart | Donor type based on giving level | msnfp_transaction | Yes | Fiscal year only |
| One-off vs recurring gifts by month | Stacked column chart | Monthly distribution of donations split between single and recurring gifts | msnfp_transaction | Yes | Fiscal year only |
| Donors by year of lapsed giving | Donut chart | Total number of unique donors showing the year of last donation | msnfp_transaction | No | All years |
| Donors by giving level | Overlay on donut chart | Unique donors who have ever given funds | msnfp_transaction | No | All years |
Revenue
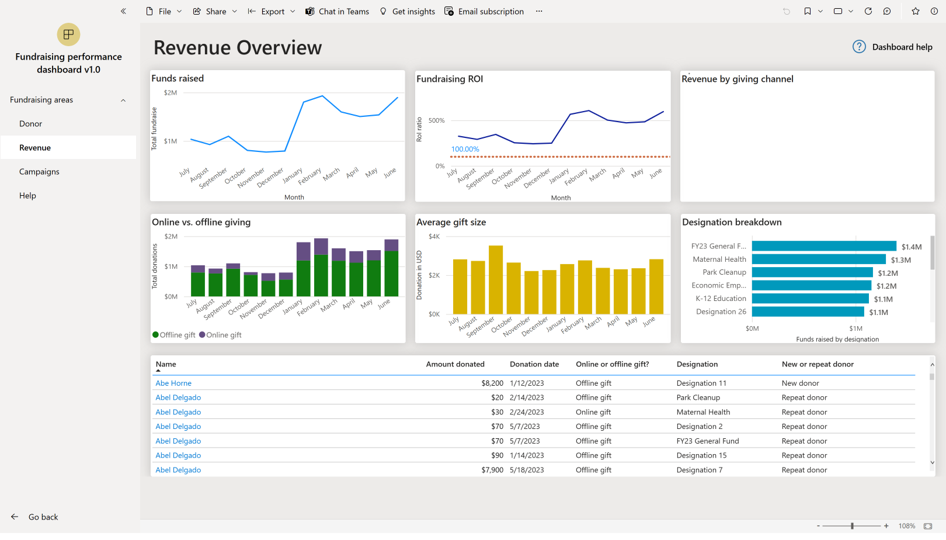
View key gifts and revenue metrics on the Revenue page, including return on investment (ROI) and channel breakdowns. The Revenue page also contains a table of individual donations, which you can filter with controls in the header row.

| Tile | Type | Purpose | Table | Interactive | Time period |
|---|---|---|---|---|---|
| Revenue by month | Line chart | Total monthly revenue for each month of the current fiscal year | msnfp_transaction | Yes | Fiscal year only |
| ROI of campaign | Line chart | Monthly return on investment | msnfp_transaction, campaign | Yes | Fiscal year only |
| Revenue by giving channel | Bar chart | Total revenue received by each giving channel | msnfp_transaction | Yes | Fiscal year only |
| Online vs offline giving | Stacked column chart | Monthly display of the total revenue split by offline or online donations | msnfp_transaction | Yes | Fiscal year only |
| Average gift size | Column chart | Monthly display of the average gift size | msnfp_transaction | Yes | Fiscal year only |
| Designations | Bar chart | Total revenue split between the different designations | msnfp_transaction | Yes | Fiscal year only |
| Donor list | Table | A list of donors showing details of their donation. This table is a scroll through list that can't be filtered. | msnfp_transaction, contact | No | Fiscal year only |
Campaigns
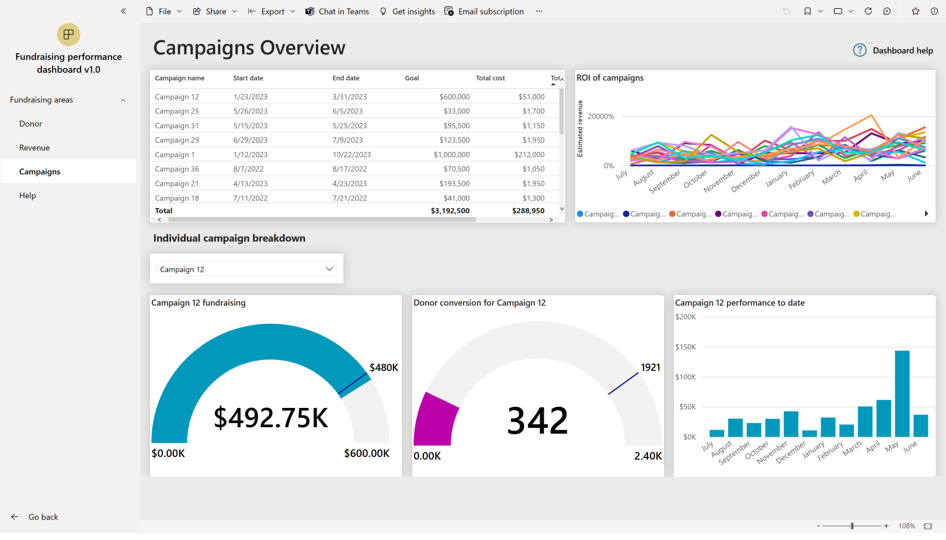
The Campaigns page helps you examine and compare the progress of individual fundraising campaigns against each other and against their individual revenue goals. This area captures any campaigns that have been active in your current fiscal year and provides metrics on them. A dropdown in the lower half of the page allows you to select individual campaigns, which then focus the bottom three visualizations to the scope of that campaign.

| Tile | Type | Purpose | Table | Interactive | Time period |
|---|---|---|---|---|---|
| List of campaigns | Table | Interactive list of all campaigns in the current fiscal year that filter only the adjacent line chart | campaign | Yes | Fiscal year only |
| ROI of campaigns | Line chart | Estimated yearly revenue that can filter the first table | campaign, msnfp_transaction | Yes | Fiscal year only |
| Individual campaign selector | List | Campaigns to feed the other charts | campaign, msnfp_transaction | Yes | Fiscal year only |
| Campaign fundraising | Gauge chart | Fundraising target and funds raised to date for the selected campaign | campaign, msnfp_transaction, list | No | Fiscal year only |
| Donor conversion | Gauge chart | Opportunities that have converted to donors compared to the conversion target | msnfp_transaction, list | No | Fiscal year only |
| Performance to date | Column chart | Monthly income for the selected campaign | msnfp_transaction | Y | Fiscal year only |
For more information about the Nonprofit Common Data Model, go to Nonprofit Common Data Model.
For more information about Power BI, go to Power BI documentation.