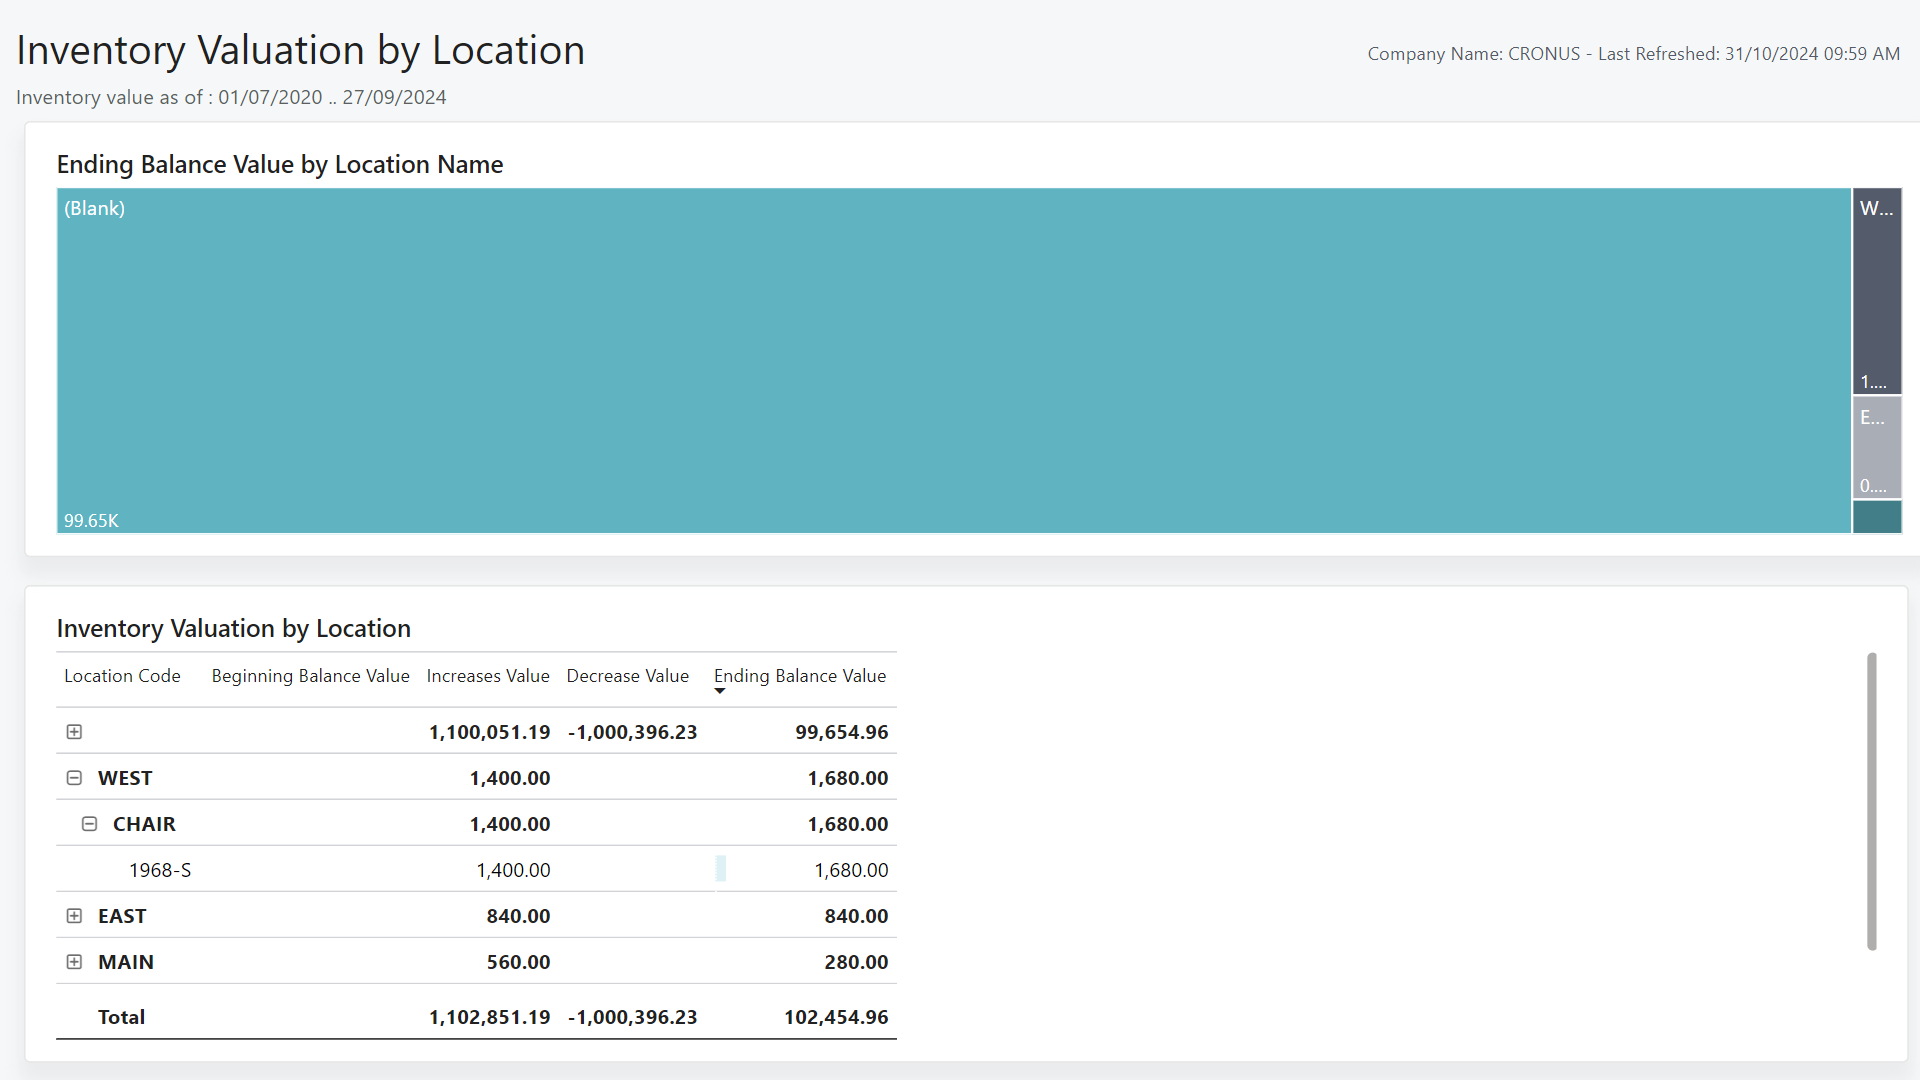
Inventory Valuation Overview (Power BI Report)
APPLIES TO: Generally available in Business Central 2024 release wave 2 (version 25.1).
The Inventory Valuation by Overview report provides a high-level view of key valuation data for your organization. Use the report to identify key values across the organization and get a clear understanding on valuation movements.
Use the report
The report gives executives and managers key information about the value of their inventory.
Executives use the report to get a high-level view of the company's inventory value. This information helps you make quick, informed strategic decisions.
Managers use the report to get a clear picture of the total value of on-hand inventory. You can also use this report to see key movements.
Key Performance Indicators (KPIs)
The Inventory Valuation Overview report includes the following KPIs:
- Ending Balance Value
- Ending Balance Posted to G/L
- Variance
- Invoiced Quantity
- Increases Quantity
- Decrease Qty.
Click on the link for a KPI to learn more about what it means, how it is calculated, and what data was used in the calculations.
Tip
You can easily track the KPIs that the Power BI reports display against your business objectives. To learn more, go to Track your business KPIs with Power BI metrics.
Data used in the Inventory Valuation Overview report
The report uses data from the following tables in Business Central:
- Location
- Value Entries
Try the report
Try the report here: Inventory Valuation Overview
Tip
If you hold down the CTRL key while you select the report link, the report opens on a new browser tab. In this way, you can stay on the current page while you explore the report on the other browser tab.
See also
Track KPIs with Power BI metrics
Power BI Inventory Valuation app
Ad hoc analysis of inventory data
Built-in inventory and warehouse reports
Inventory analytics overview
Inventory overview
