Run the client analyzer on Windows
Applies to:
Option 1: Live response
You can collect the Defender for Endpoint analyzer support logs remotely using Live Response.
Option 2: Run MDE Client Analyzer locally
Download the MDE Client Analyzer tool or Beta MDE Client Analyzer tool to the Windows device you want to investigate.
The file is saved to your Downloads folder by default.
Extract the contents of MDEClientAnalyzer.zip to an available folder.
Open a command line with administrator permissions:
- Go to Start and type cmd.
- Right-click Command prompt and select Run as administrator.
Type the following command and then press Enter:
*DrivePath*\MDEClientAnalyzer.cmdReplace DrivePath with the path where you extracted MDEClientAnalyzer, for example:
C:\Work\tools\MDEClientAnalyzer\MDEClientAnalyzer.cmd
In addition to the previous procedure, you can also collect the analyzer support logs using live response..
Note
On Windows 10 and 11, Windows Server 2019 and 2022, or Windows Server 2012R2 and 2016 with the modern unified solution installed, the client analyzer script calls into an executable file called MDEClientAnalyzer.exe to run the connectivity tests to cloud service URLs.
On Windows 8.1, Windows Server 2016 or any previous OS edition where Microsoft Monitoring Agent (MMA) is used for onboarding, the client analyzer script calls into an executable file called MDEClientAnalyzerPreviousVersion.exe to run connectivity tests for Command and Control (CnC) URLs while also calling into Microsoft Monitoring Agent connectivity tool TestCloudConnection.exe for Cyber Data channel URLs.
Important points to keep in mind
All the PowerShell scripts and modules included with the analyzer are Microsoft-signed. If files were modified in any way, then the analyzer is expected to exit with the following error:
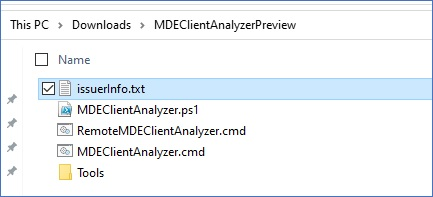
If you see this error, the issuerInfo.txt output contains detailed information about why this happened and the affected file:
Example contents after MDEClientAnalyzer.ps1 is modified:
Result package contents on Windows
Note
The exact files captured may change depending on factors such as:
- The version of windows on which the analyzer is run.
- Event log channel availability on the machine.
- The start state of the EDR sensor (Sense is stopped if machine is not yet onboarded).
- If an advanced troubleshooting parameter was used with the analyzer command.
By default, the unpacked MDEClientAnalyzerResult.zip file contains the following items.
MDEClientAnalyzer.htm
This is the main HTML output file, which will contain the findings and guidance that the analyzer script run on the machine can produce.
SystemInfoLogs [Folder]
AddRemovePrograms.csv
Description: List of x64 installed software on x64 OS collected from registry.
AddRemoveProgramsWOW64.csv
Description: List of x86 installed software on x64 OS collected from registry.
CertValidate.log
Description: Detailed result from certificate revocation executed by calling into CertUtil.
dsregcmd.txt
Description: Output from running dsregcmd. This provides details about the Microsoft Entra status of the machine.
IFEO.txt
Description: Output of Image File Execution Options configured on the machine
MDEClientAnalyzer.txt
Description: This is verbose text file showing with details of the analyzer script execution.
MDEClientAnalyzer.xml
Description: XML format containing the analyzer script findings.
RegOnboardedInfoCurrent.Json
Description: The onboarded machine information gathered in JSON format from the registry.
RegOnboardingInfoPolicy.Json
Description: The onboarding policy configuration gathered in JSON format from the registry.
SCHANNEL.txt
Description: Details about SCHANNEL configuration applied to the machine such gathered from registry.
SessionManager.txt
Description: Session Manager specific settings gather from registry.
SSL_00010002.txt
Description: Details about SSL configuration applied to the machine gathered from registry.
EventLogs [Folder]
utc.evtx
Description: Export of DiagTrack event log
senseIR.evtx
Description: Export of the Automated Investigation event log
sense.evtx
Description: Export of the Sensor main event log
OperationsManager.evtx
Description: Export of the Microsoft Monitoring Agent event log
MdeConfigMgrLogs [Folder]
SecurityManagementConfiguration.json
Description: Configurations sent from MEM (Microsoft Endpoint Manager) for enforcement.
policies.json
Description: Policies settings to be enforced on the device.
report_xxx.json
Description: Corresponding enforcement results.
See also
- Client analyzer overview
- Download and run the client analyzer
- Data collection for advanced troubleshooting on Windows
- Understand the analyzer HTML report
Tip
Do you want to learn more? Engage with the Microsoft Security community in our Tech Community: Microsoft Defender for Endpoint Tech Community.


