Create a connection monitor using the Azure portal
This article describes how to create a monitor in Connection monitor using the Azure portal. Connection monitor supports hybrid and Azure cloud deployments.
Important
Connection monitor (classic) is deprecated and no longer available. For more information, see Migrate from connection monitor (classic) to migrate your connection monitors from connection monitor (classic) to the new connection monitor.
Before you begin
In monitors that you create by using Connection monitor, you can add on-premises machines, Azure virtual machines (VMs), and Azure Virtual Machine Scale Sets as sources. These connection monitors can also monitor connectivity to endpoints. The endpoints can be on Azure or on any other URL or IP.
Here are some definitions to get you started:
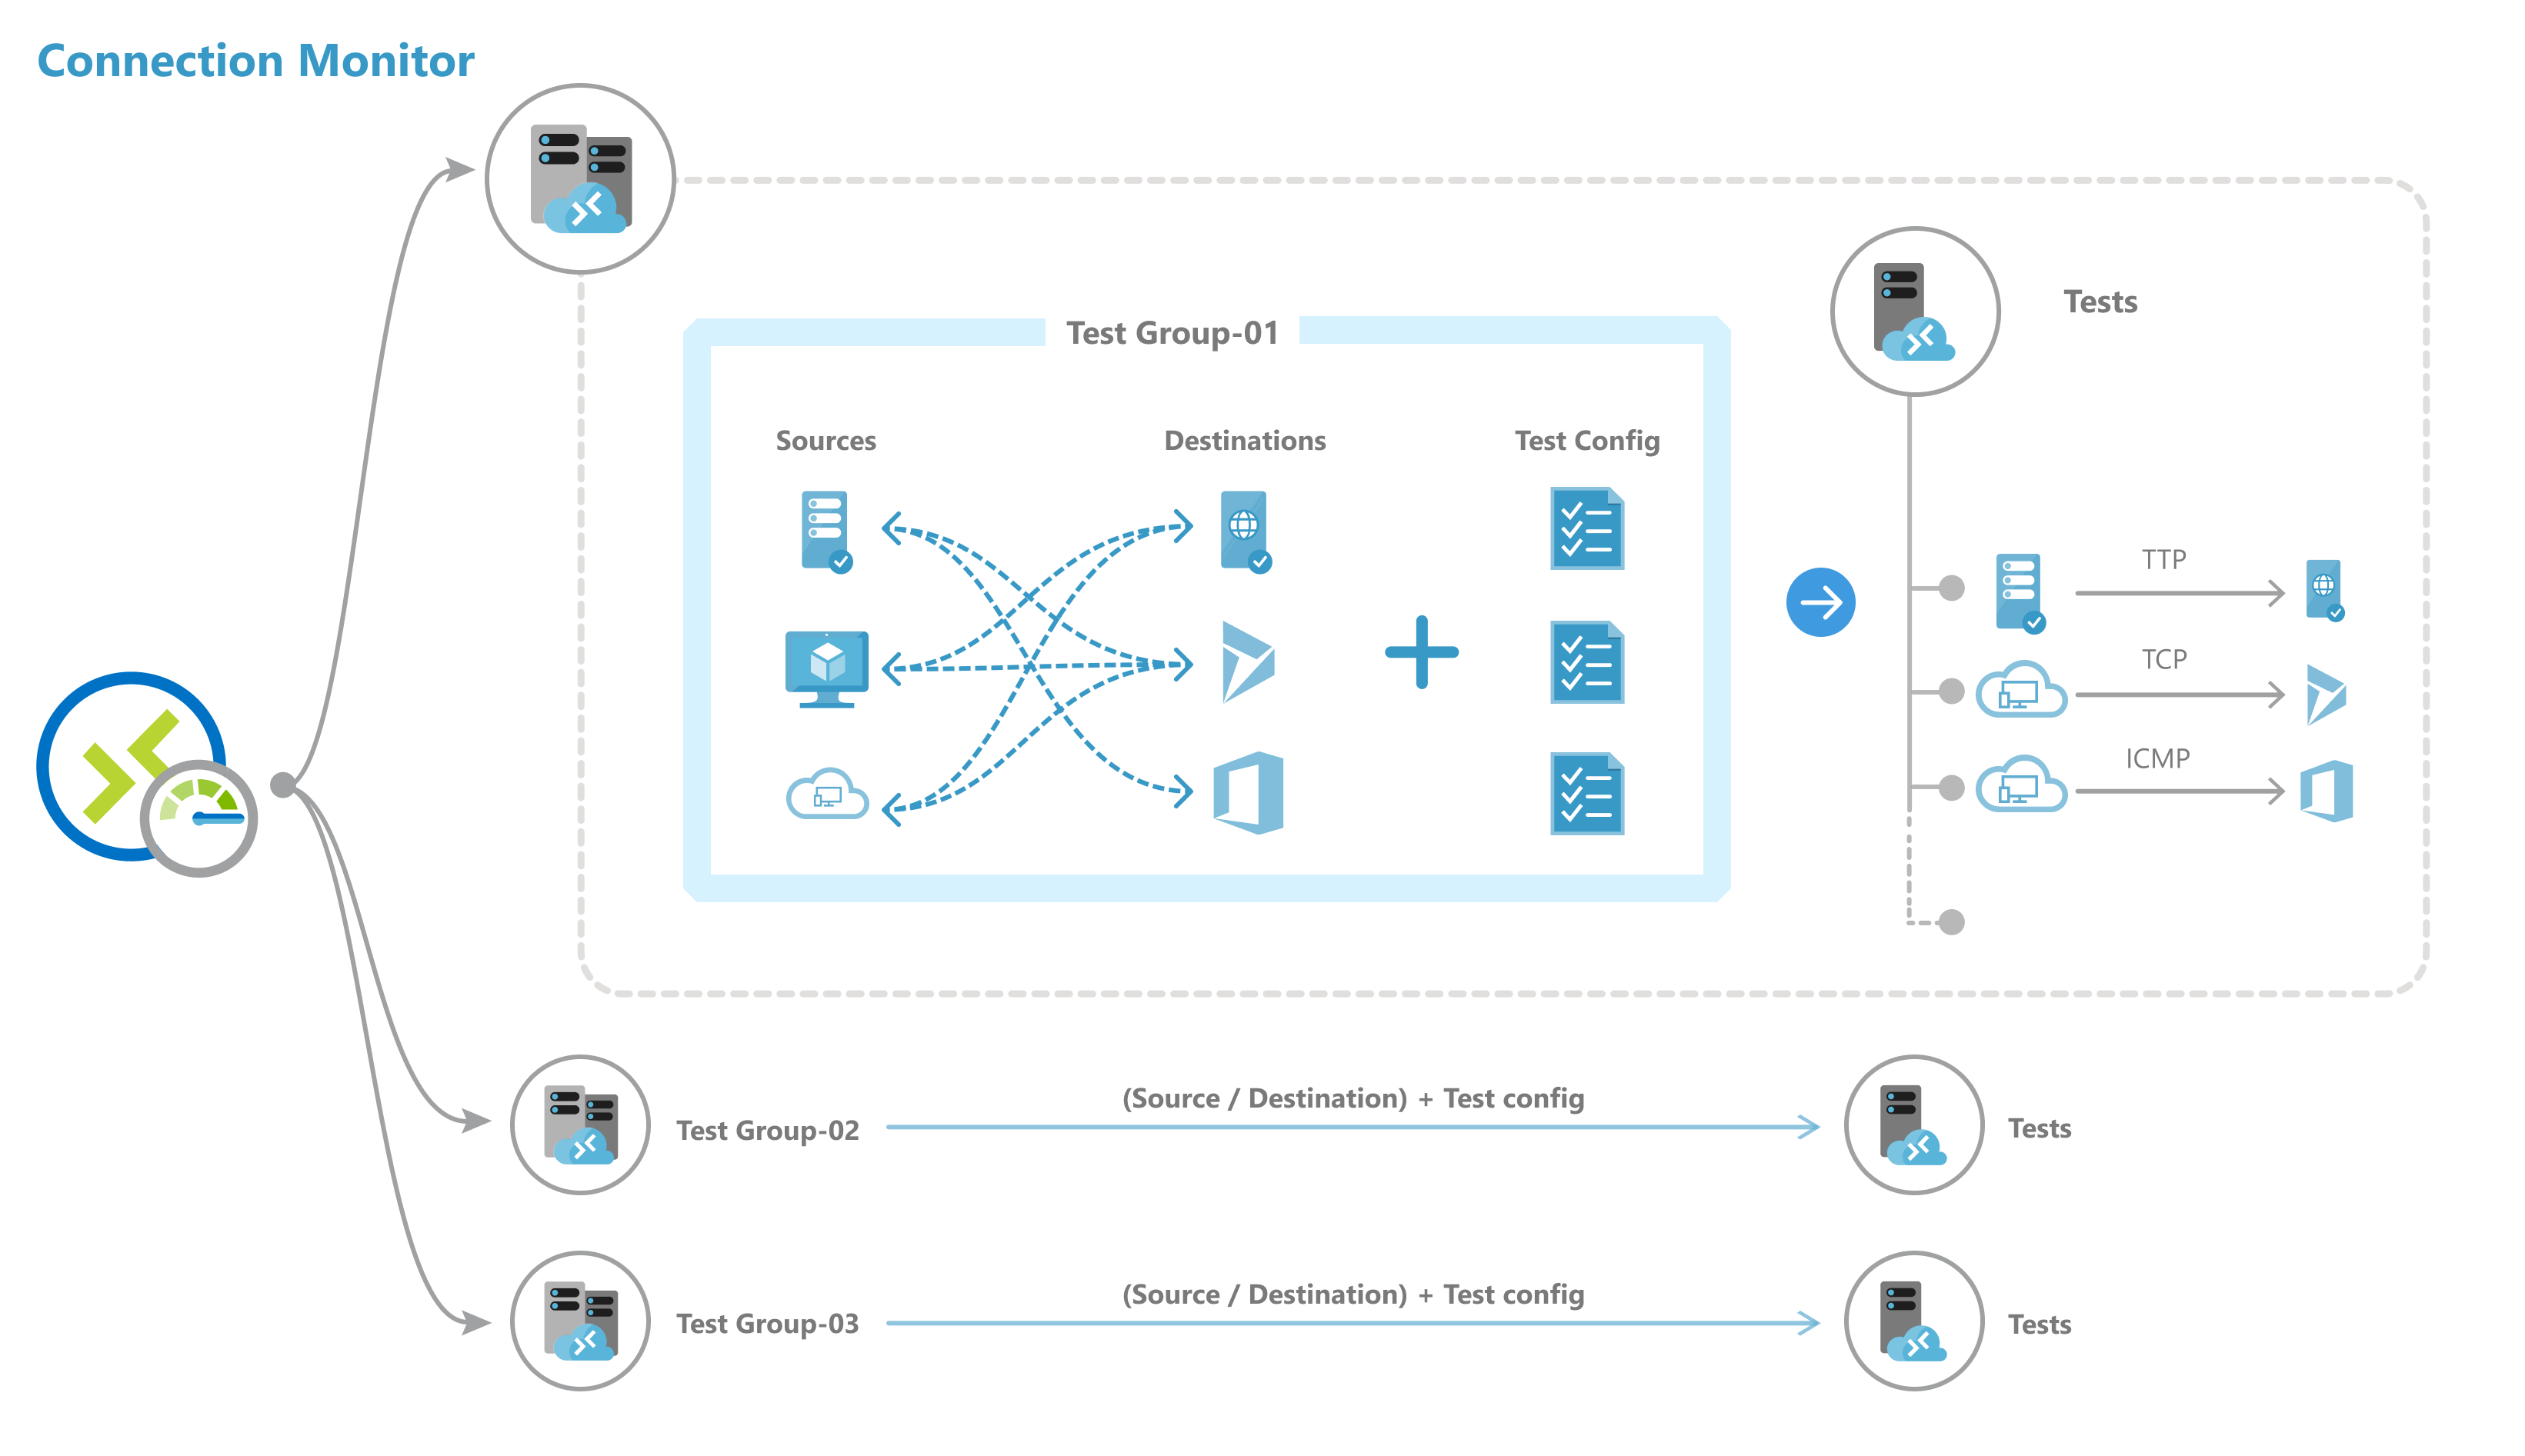
Connection monitor resource: A region-specific Azure resource. All the following entities are properties of a connection monitor resource.
Endpoint: A source or destination that participates in connectivity checks. Examples of endpoints include:
- Azure VMs
- Azure virtual networks
- Azure subnets
- On-premises agents
- On-premises subnets
- On-premises custom networks that include multiple subnets
- URLs and IPs
Test configuration: A protocol-specific configuration for a test. Depending on the protocol you choose, you can define the port, thresholds, test frequency, and other elements.
Test group: The group that contains source endpoints, destination endpoints, and test configurations. A connection monitor can contain more than one test group.
Test: The combination of a source endpoint, destination endpoint, and test configuration. A test is the most granular level at which monitoring data is available. The monitoring data includes the percentage of checks that failed and the round-trip time (RTT).
Note
Connection Monitor now supports the auto-enabling of monitoring extensions for Azure and non-Azure endpoints. You no longer have to install monitoring solutions manually while you're creating a connection monitor.
Create a connection monitor
Note
Connection Monitor now supports the Azure Monitor Agent extension. This support eliminates any dependency on the legacy Log Analytics agent.
To create a connection monitor by using the Azure portal, do the following:
In the Azure portal, go to Network Watcher.
On the left pane, in the Monitoring section, select Connection monitor.
All the monitors that have been created in Connection Monitor are displayed. To see the connection monitors that were created in classic Connection Monitor, select the Connection monitor tab.

On the Connection Monitor dashboard, select Create.
On the Basics pane, enter the following details:
- Connection Monitor Name: Enter a name for your connection monitor. Use the standard naming rules for Azure resources.
- Subscription: Select a subscription for your connection monitor.
- Region: Select a region for your connection monitor. You can select only the source VMs that are created in this region.
- Workspace configuration: Choose a custom workspace or the default workspace. Your workspace holds your monitoring data. To choose a custom workspace, clear the default workspace checkbox, and then select the subscription and region for your custom workspace.
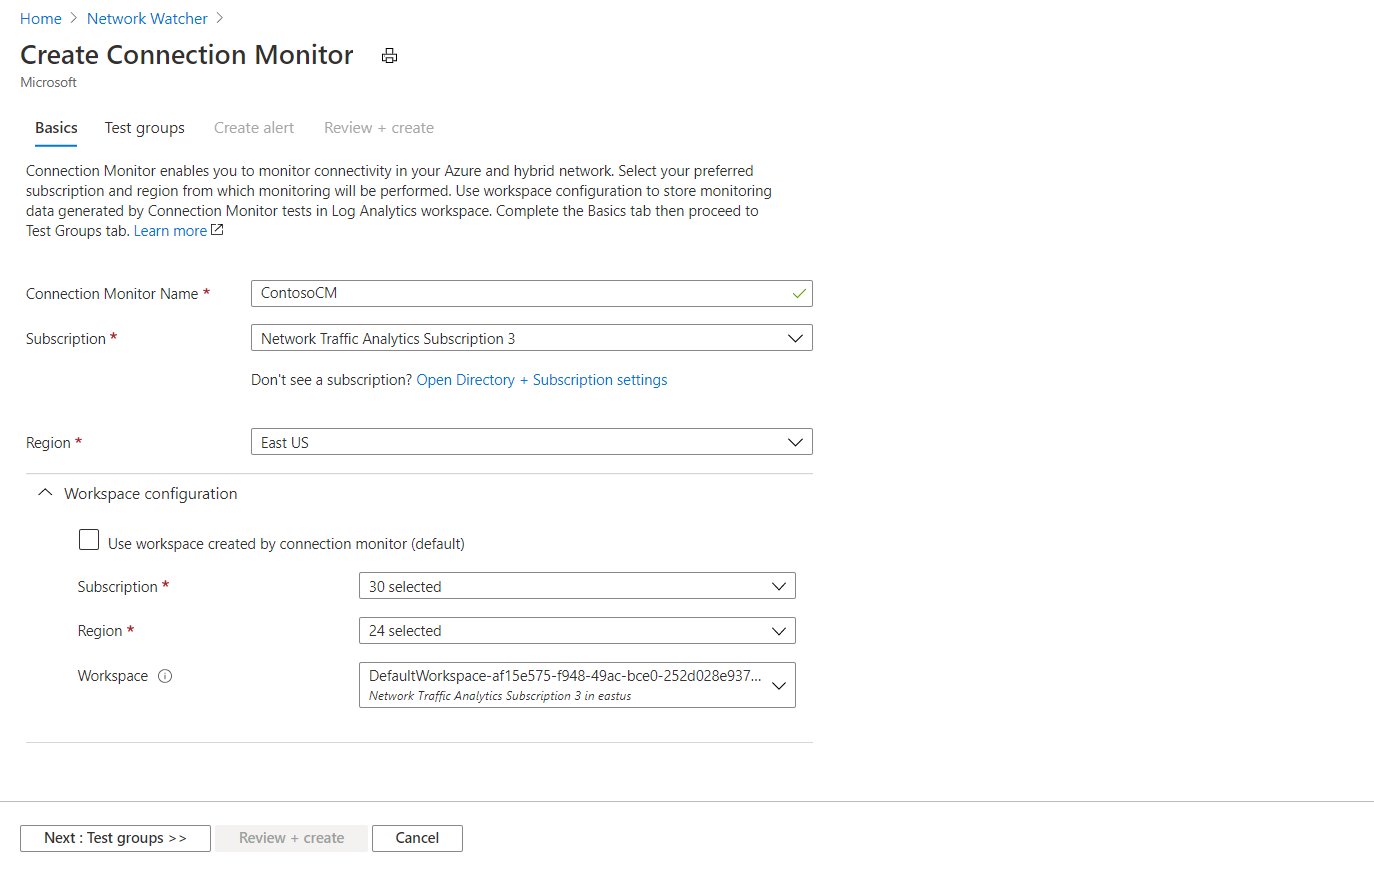
Select Next: Test groups.
Add sources, destinations, and test configurations in your test groups. To learn about setting up your test groups, see Create test groups in Connection Monitor.
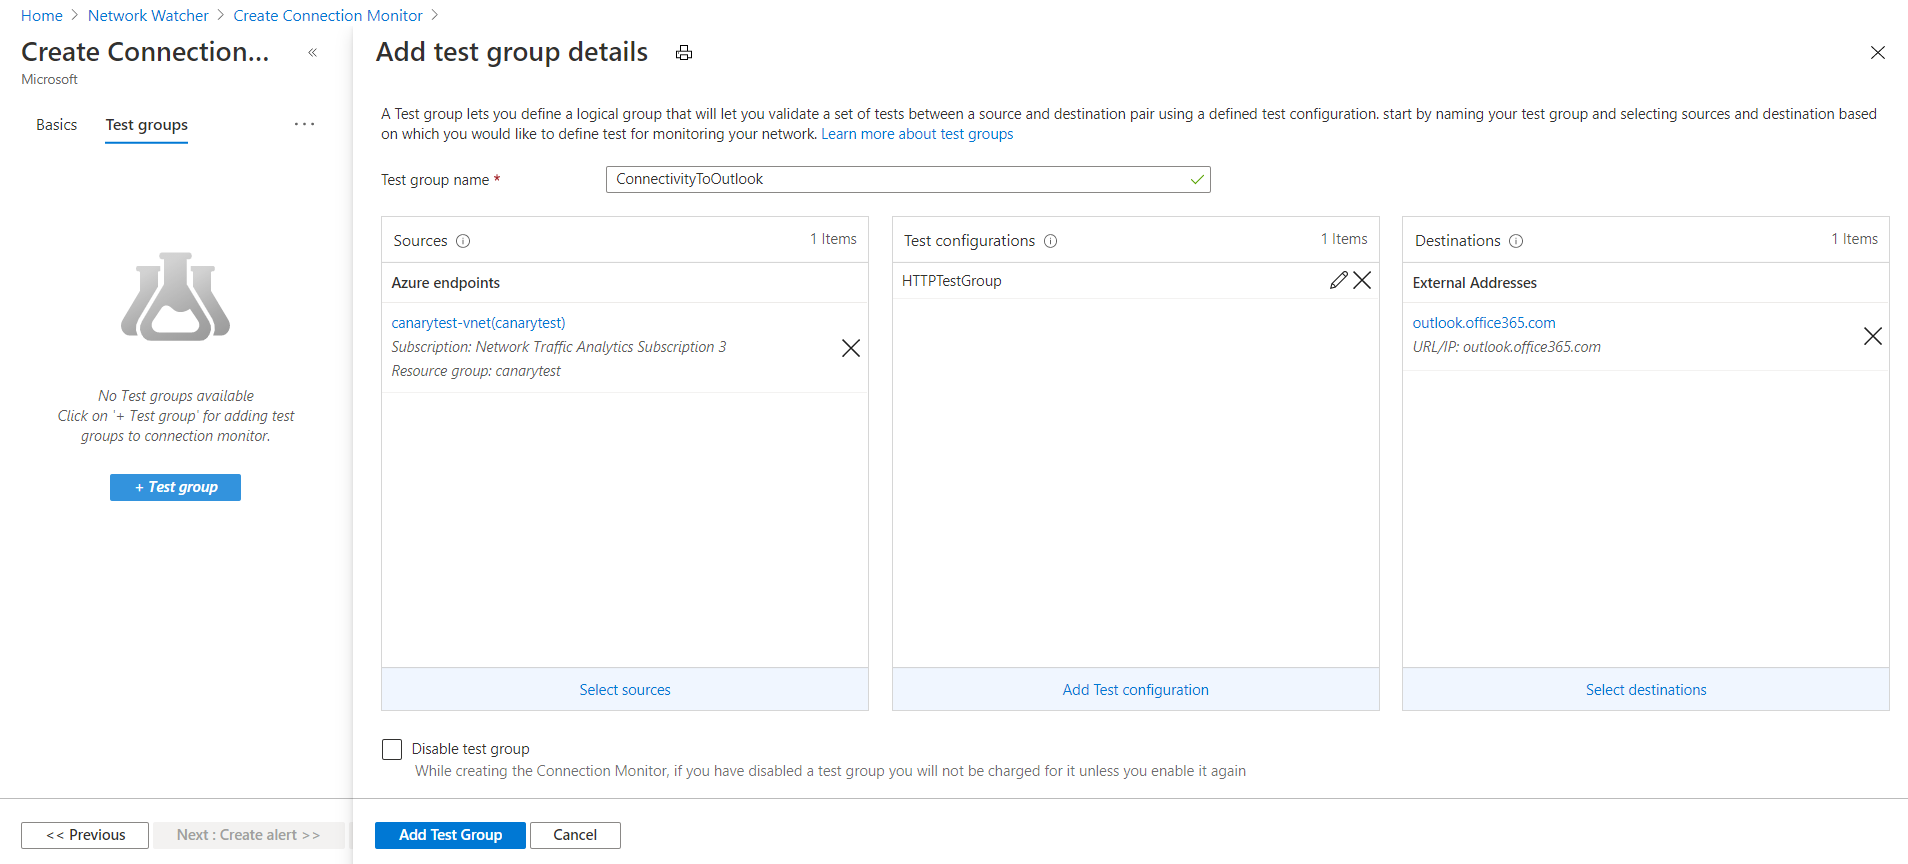
Select Next: Create Alerts. Learn more about creating alerts.
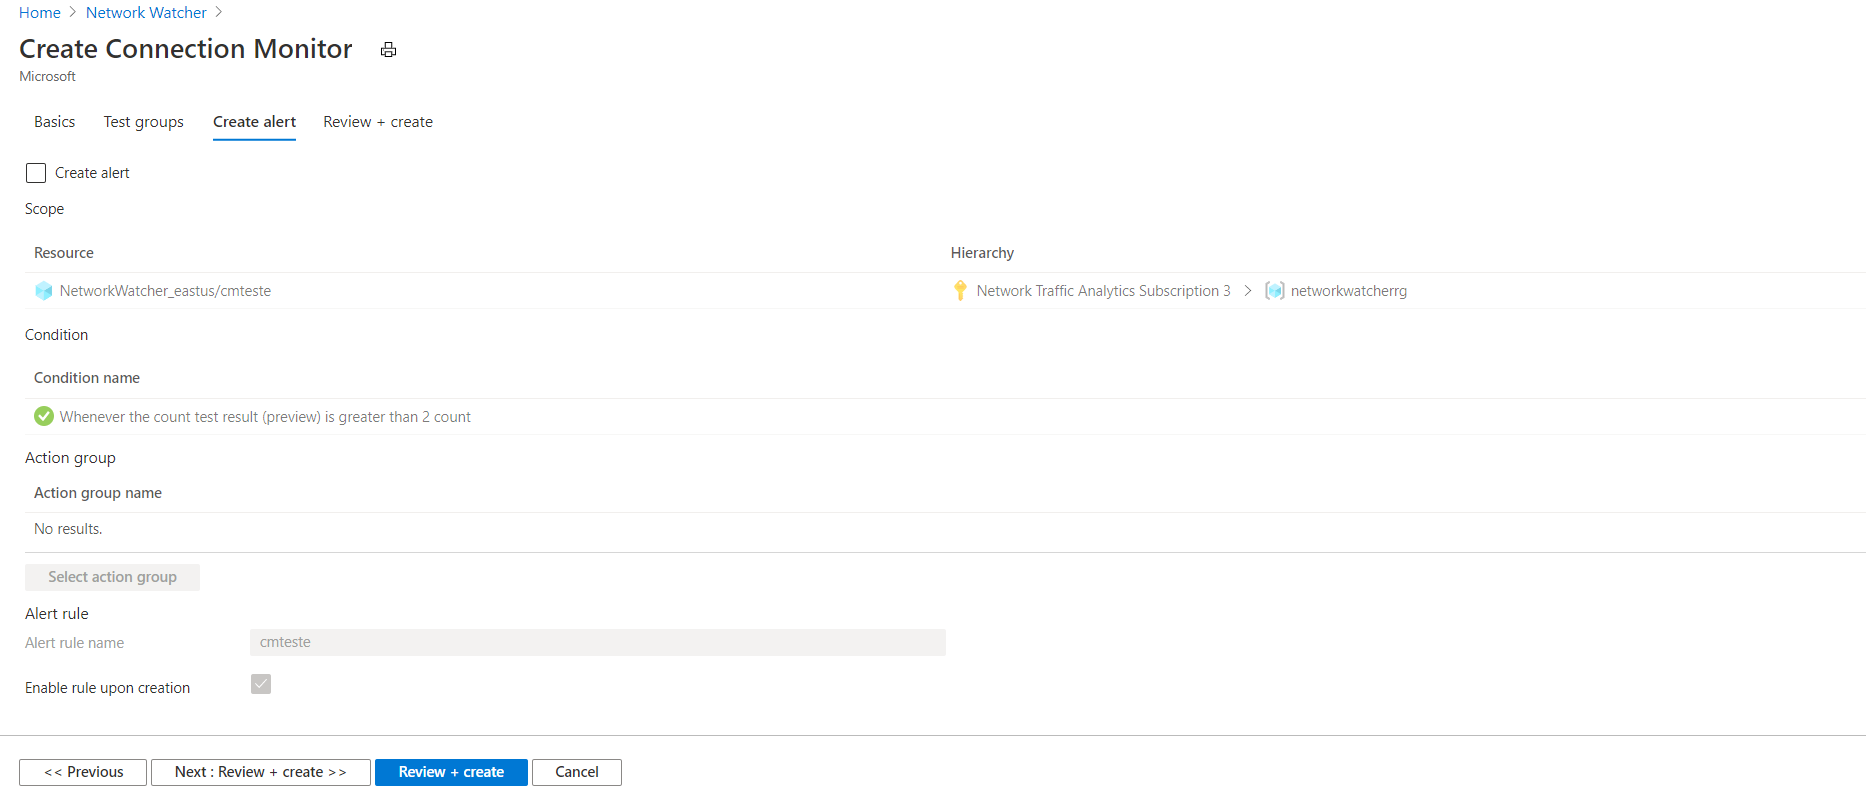
At the bottom of the pane, select Next: Review + create.
On the Review + create pane, review the basic information and test groups before you create the connection monitor. If you need to edit the connection monitor, you can do so by going back to the respective panes.
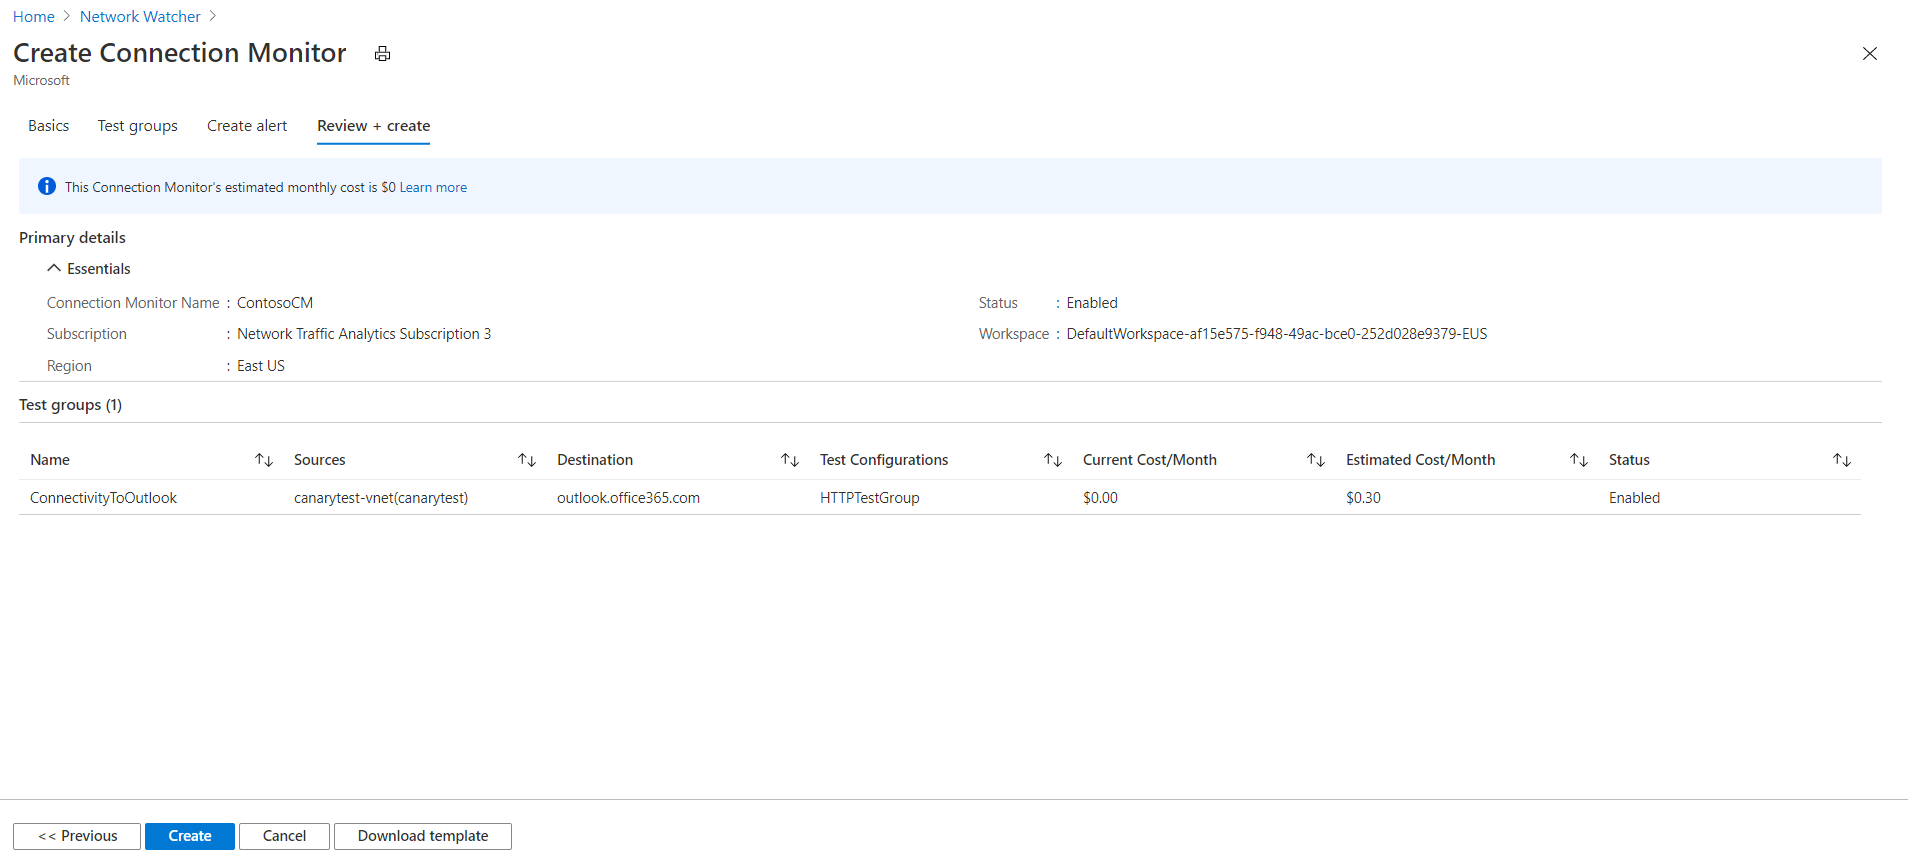
Note
The Review + create pane shows the cost per month during the connection monitor stage. Currently, the Current Cost/Month column shows no charge. When Connection Monitor becomes generally available, this column will show a monthly charge.
Even during the connection monitor stage, Log Analytics ingestion charges apply.
When you're ready to create the connection monitor, at the bottom of the Review + create pane, select Create.
Connection Monitor creates the connection monitor resource in the background.
Create test groups in a connection monitor
Note
Connection Monitor now supports the auto-enabling of monitoring extensions for Azure and non-Azure endpoints. You no longer have to install monitoring solutions manually while you're creating a connection monitor.
Each test group in a connection monitor includes sources and destinations that get tested on network elements. They're tested for the percentage of checks that fail and the RTT over test configurations.
In the Azure portal, to create a test group in a connection monitor, specify values for the following fields:
Test group Name: Enter the name of your test group.
Sources: Select Add sources to specify both Azure VMs and on-premises machines as sources if agents are installed on them. To learn about installing an agent for your source, see Monitoring agents.
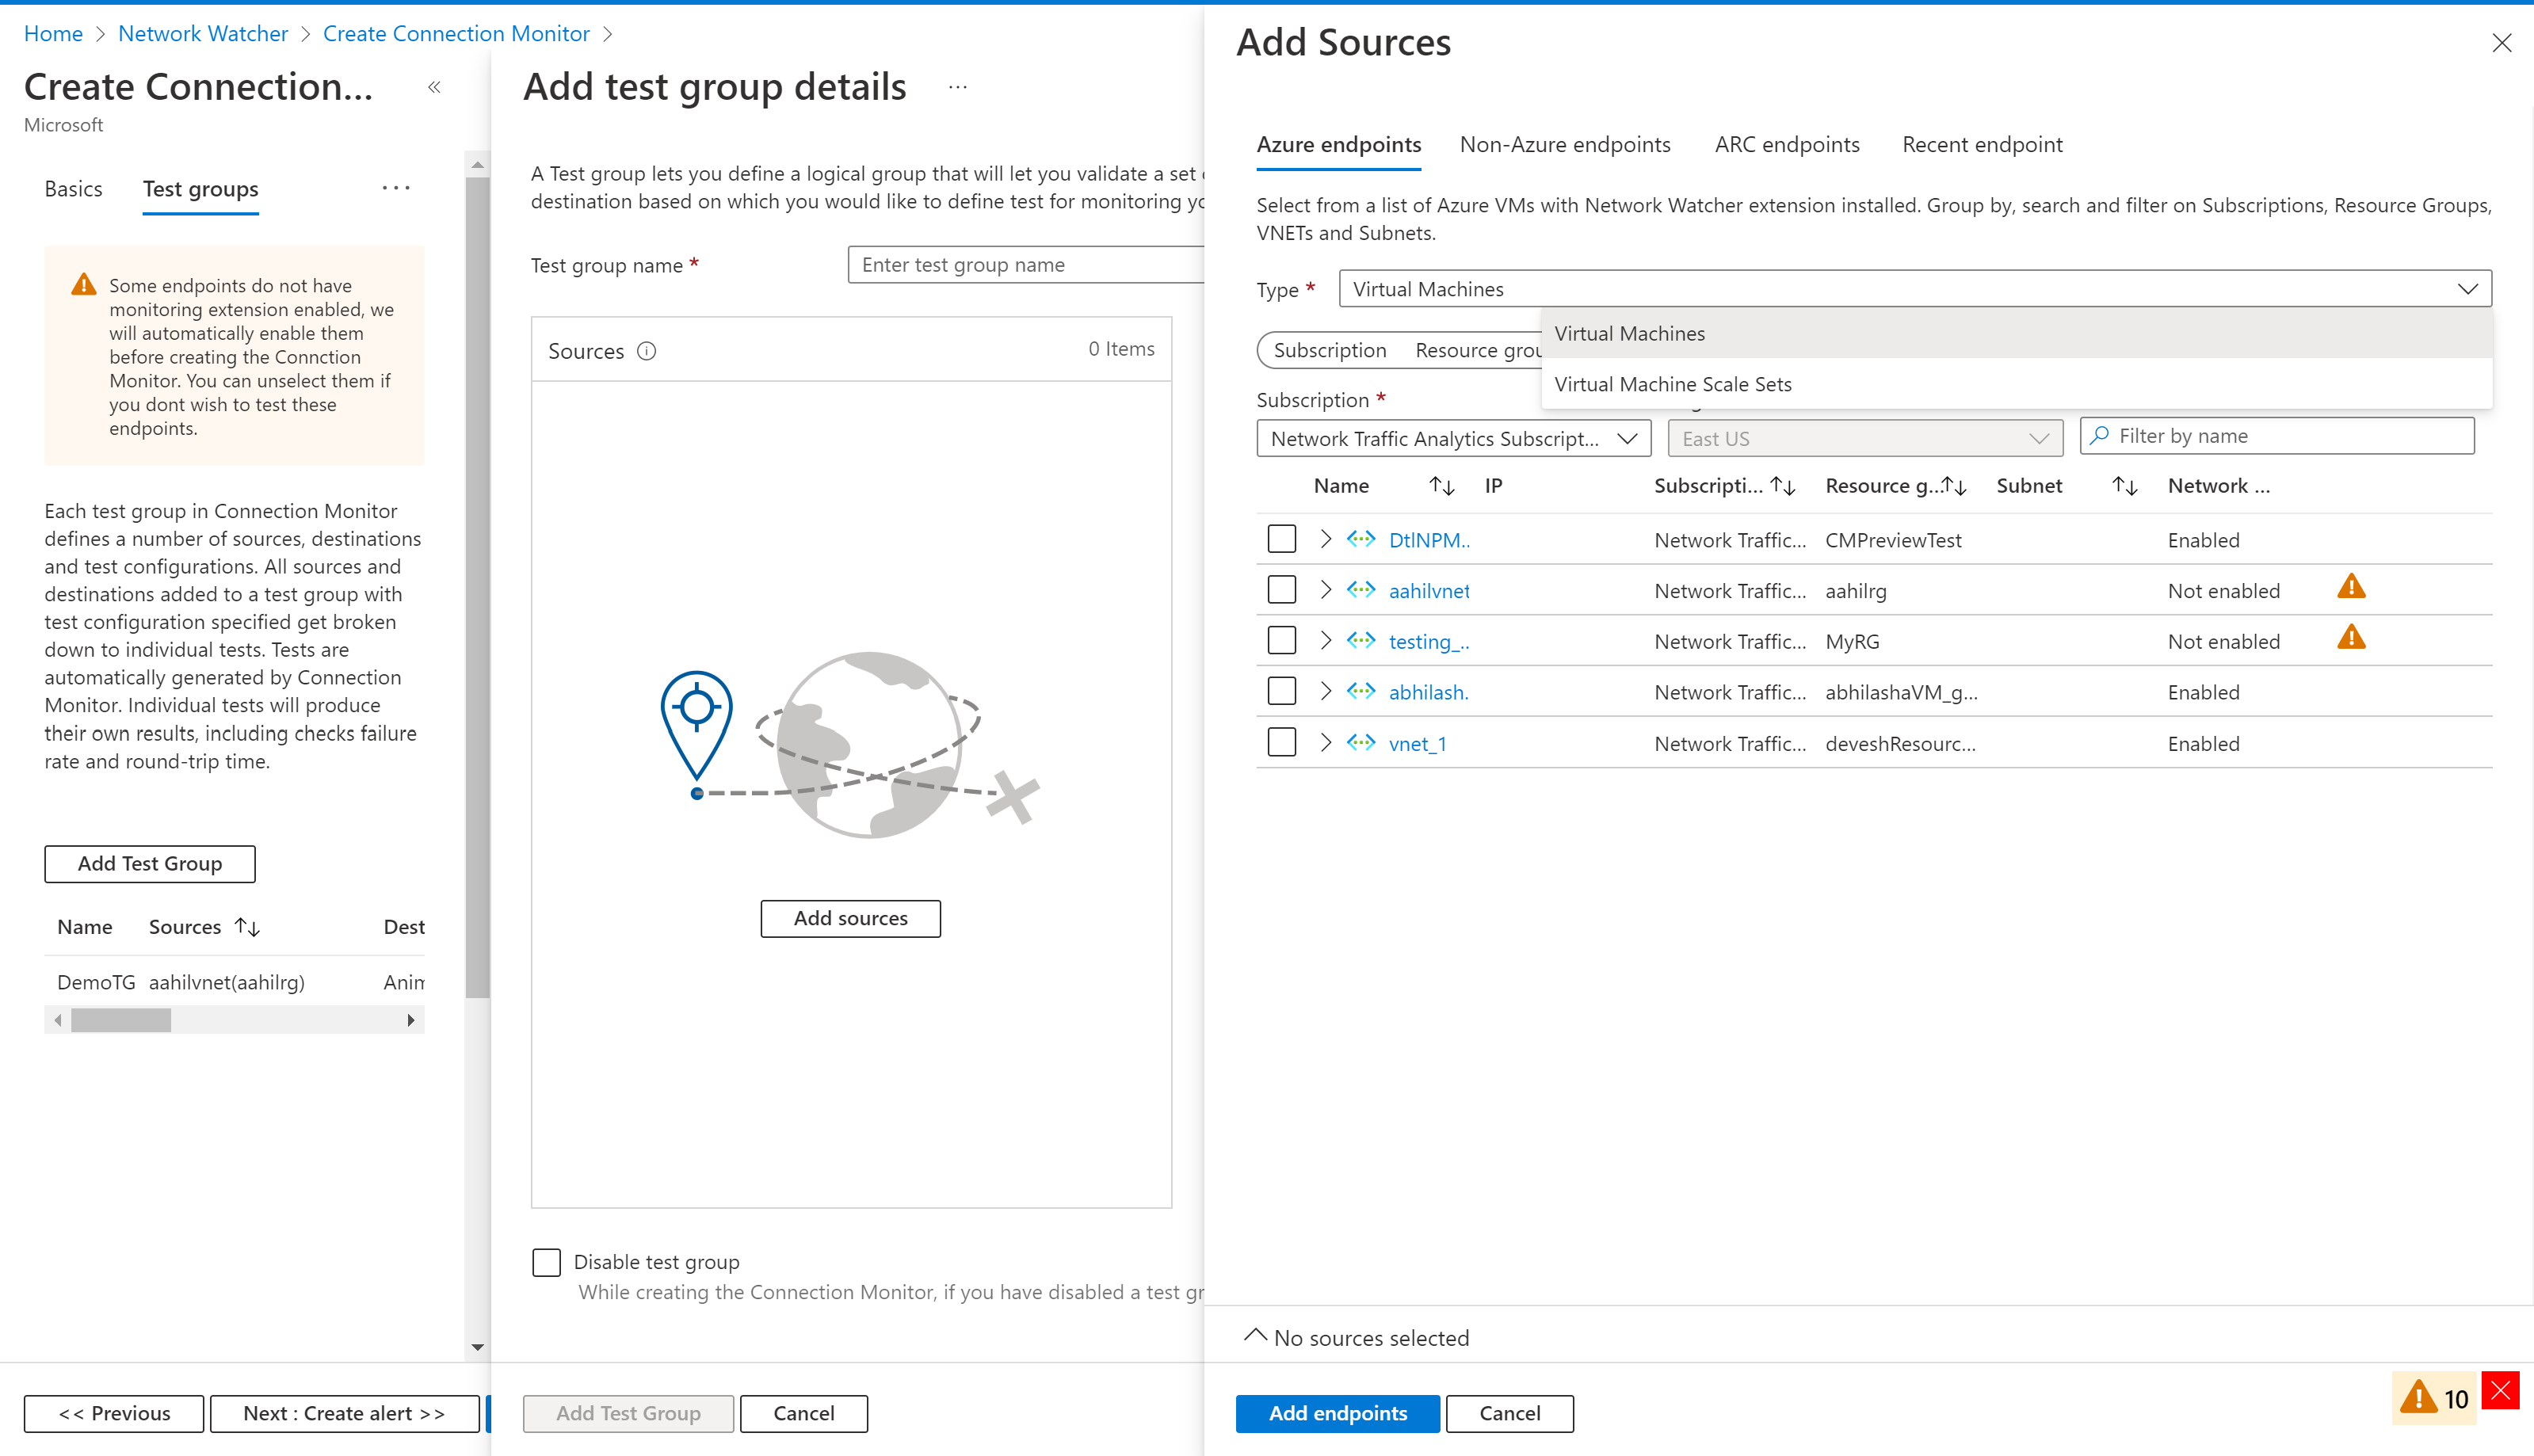
To choose Azure agents, select the Azure endpoints tab. Here you see only VMs or Virtual Machine Scale Sets that are bound to the region that you specified when you created the connection monitor. By default, VMs and Virtual Machine Scale Sets are grouped into the subscription that they belong to. These groups are collapsed.
You can drill down to further levels in the hierarchy from the Subscription level:
Subscription > Resource group > VNET > Subnet > VMs with agents
You can also change the Group by selector to start the tree from any other level. For example, if you group by virtual network, you see the VMs that have agents in the hierarchy VNET > Subnet > VMs with agents.
When you select a virtual network, subnet, a single VM, or a virtual machine scale set, the corresponding resource ID is set as the endpoint. By default, all VMs in the selected virtual network or subnet participate in monitoring. To reduce the scope, either select specific subnets or agents or change the value of the scope property.
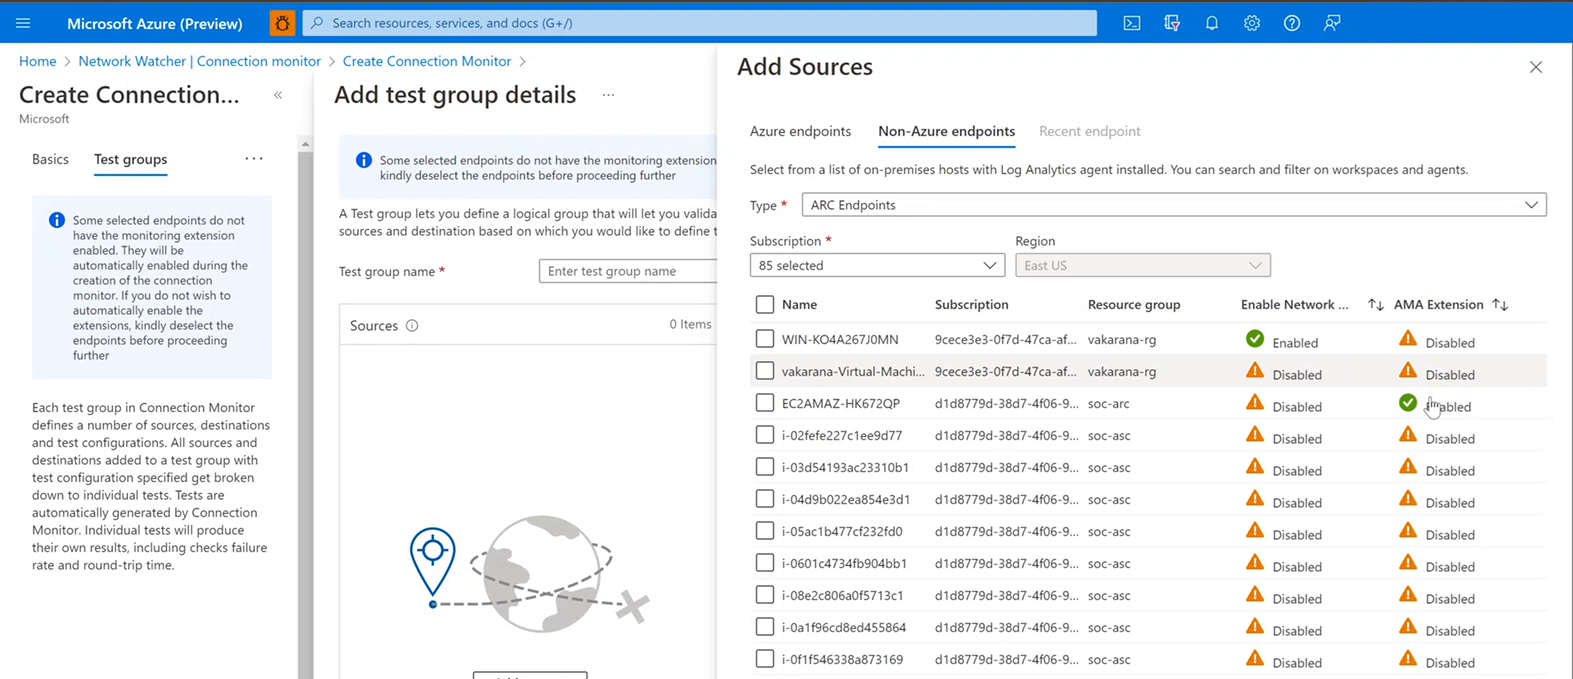
To choose on-premises agents, select the Non–Azure endpoints tab. Select from a list of on-premises hosts with a Log Analytics agent installed. Select Arc Endpoint as the Type, and select the subscriptions from the Subscription dropdown list. The list of hosts that have the Azure Arc endpoint extension and the Azure Monitor Agent extension enabled are displayed.
If you need to add Network Performance Monitor to your workspace, get it from Azure Marketplace. For information about how to add Network Performance Monitor, see Monitoring solutions in Azure Monitor. For information about how to configure agents for on-premises machines, see Monitoring connectivity from on-premises hosts.
Under Create Connection Monitor, on the Basics pane, the default region is selected. If you change the region, you can choose agents from workspaces in the new region. You can select one or more agents or subnets. In the Subnet view, you can select specific IPs for monitoring. If you add multiple subnets, a custom on-premises network named OnPremises_Network_1 will be created. You can also change the Group by selector to group by agents.
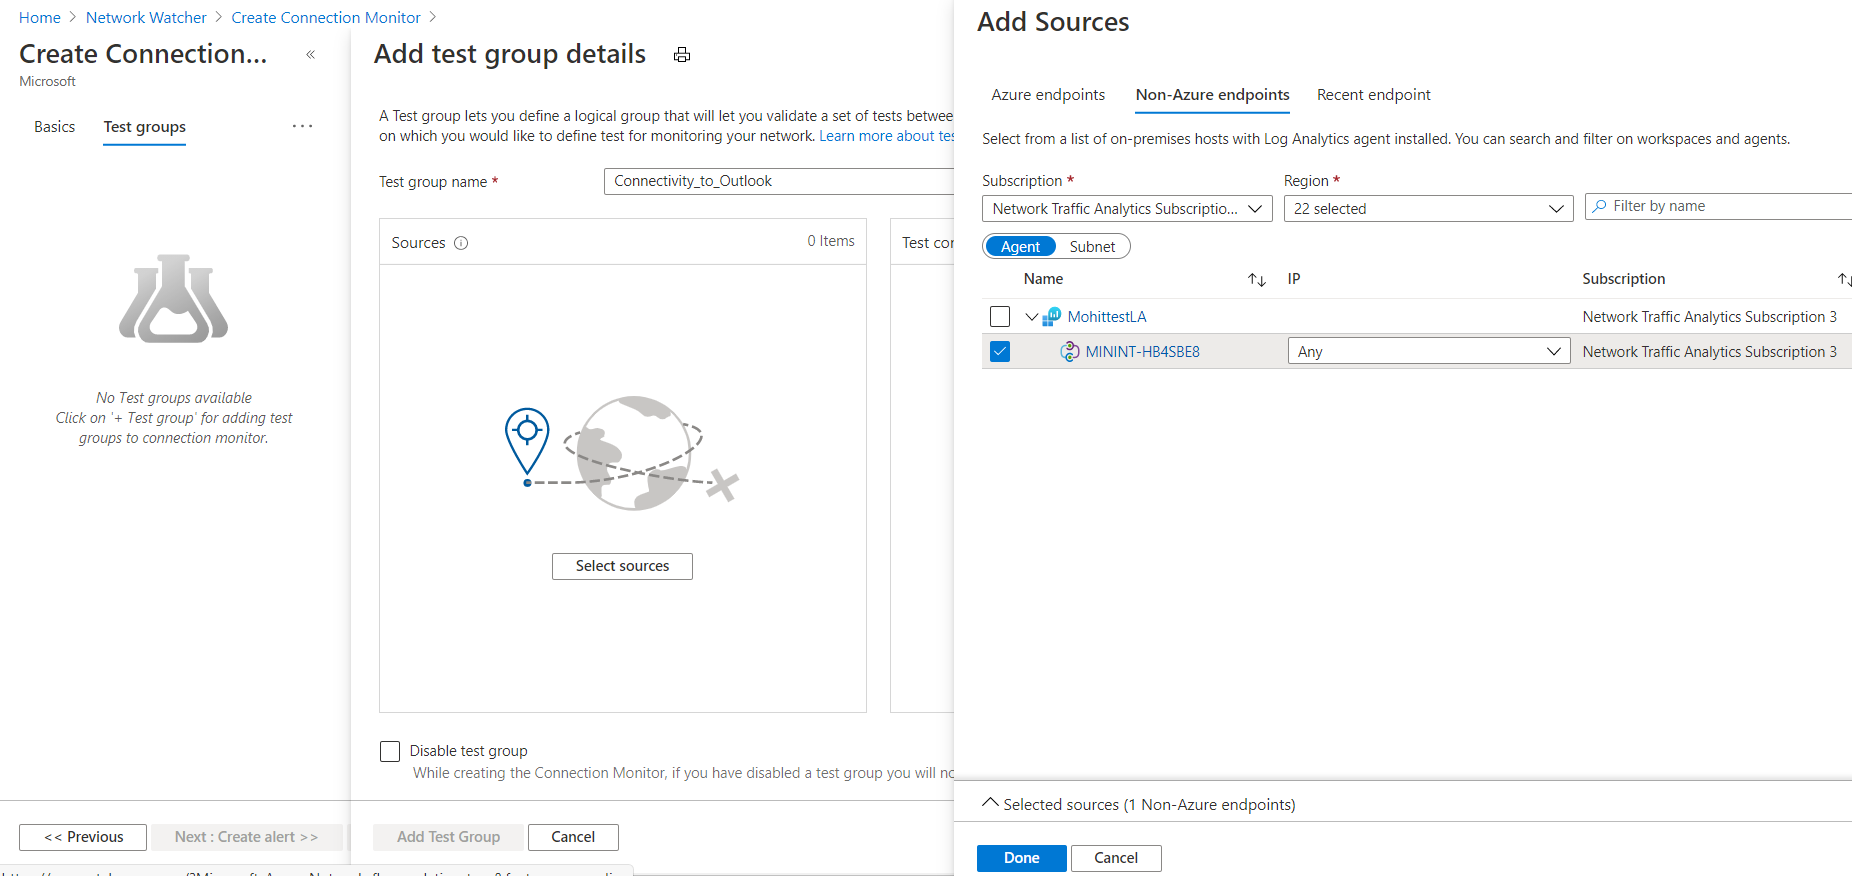
Select the recently used endpoints from the Recent endpoint pane.
You need not choose the endpoints with monitoring agents enabled only. You can select Azure or non-Azure endpoints without the agent enabled and proceed with the creation of the connection monitor. During the creation process, the monitoring agents for the endpoints will be automatically enabled.
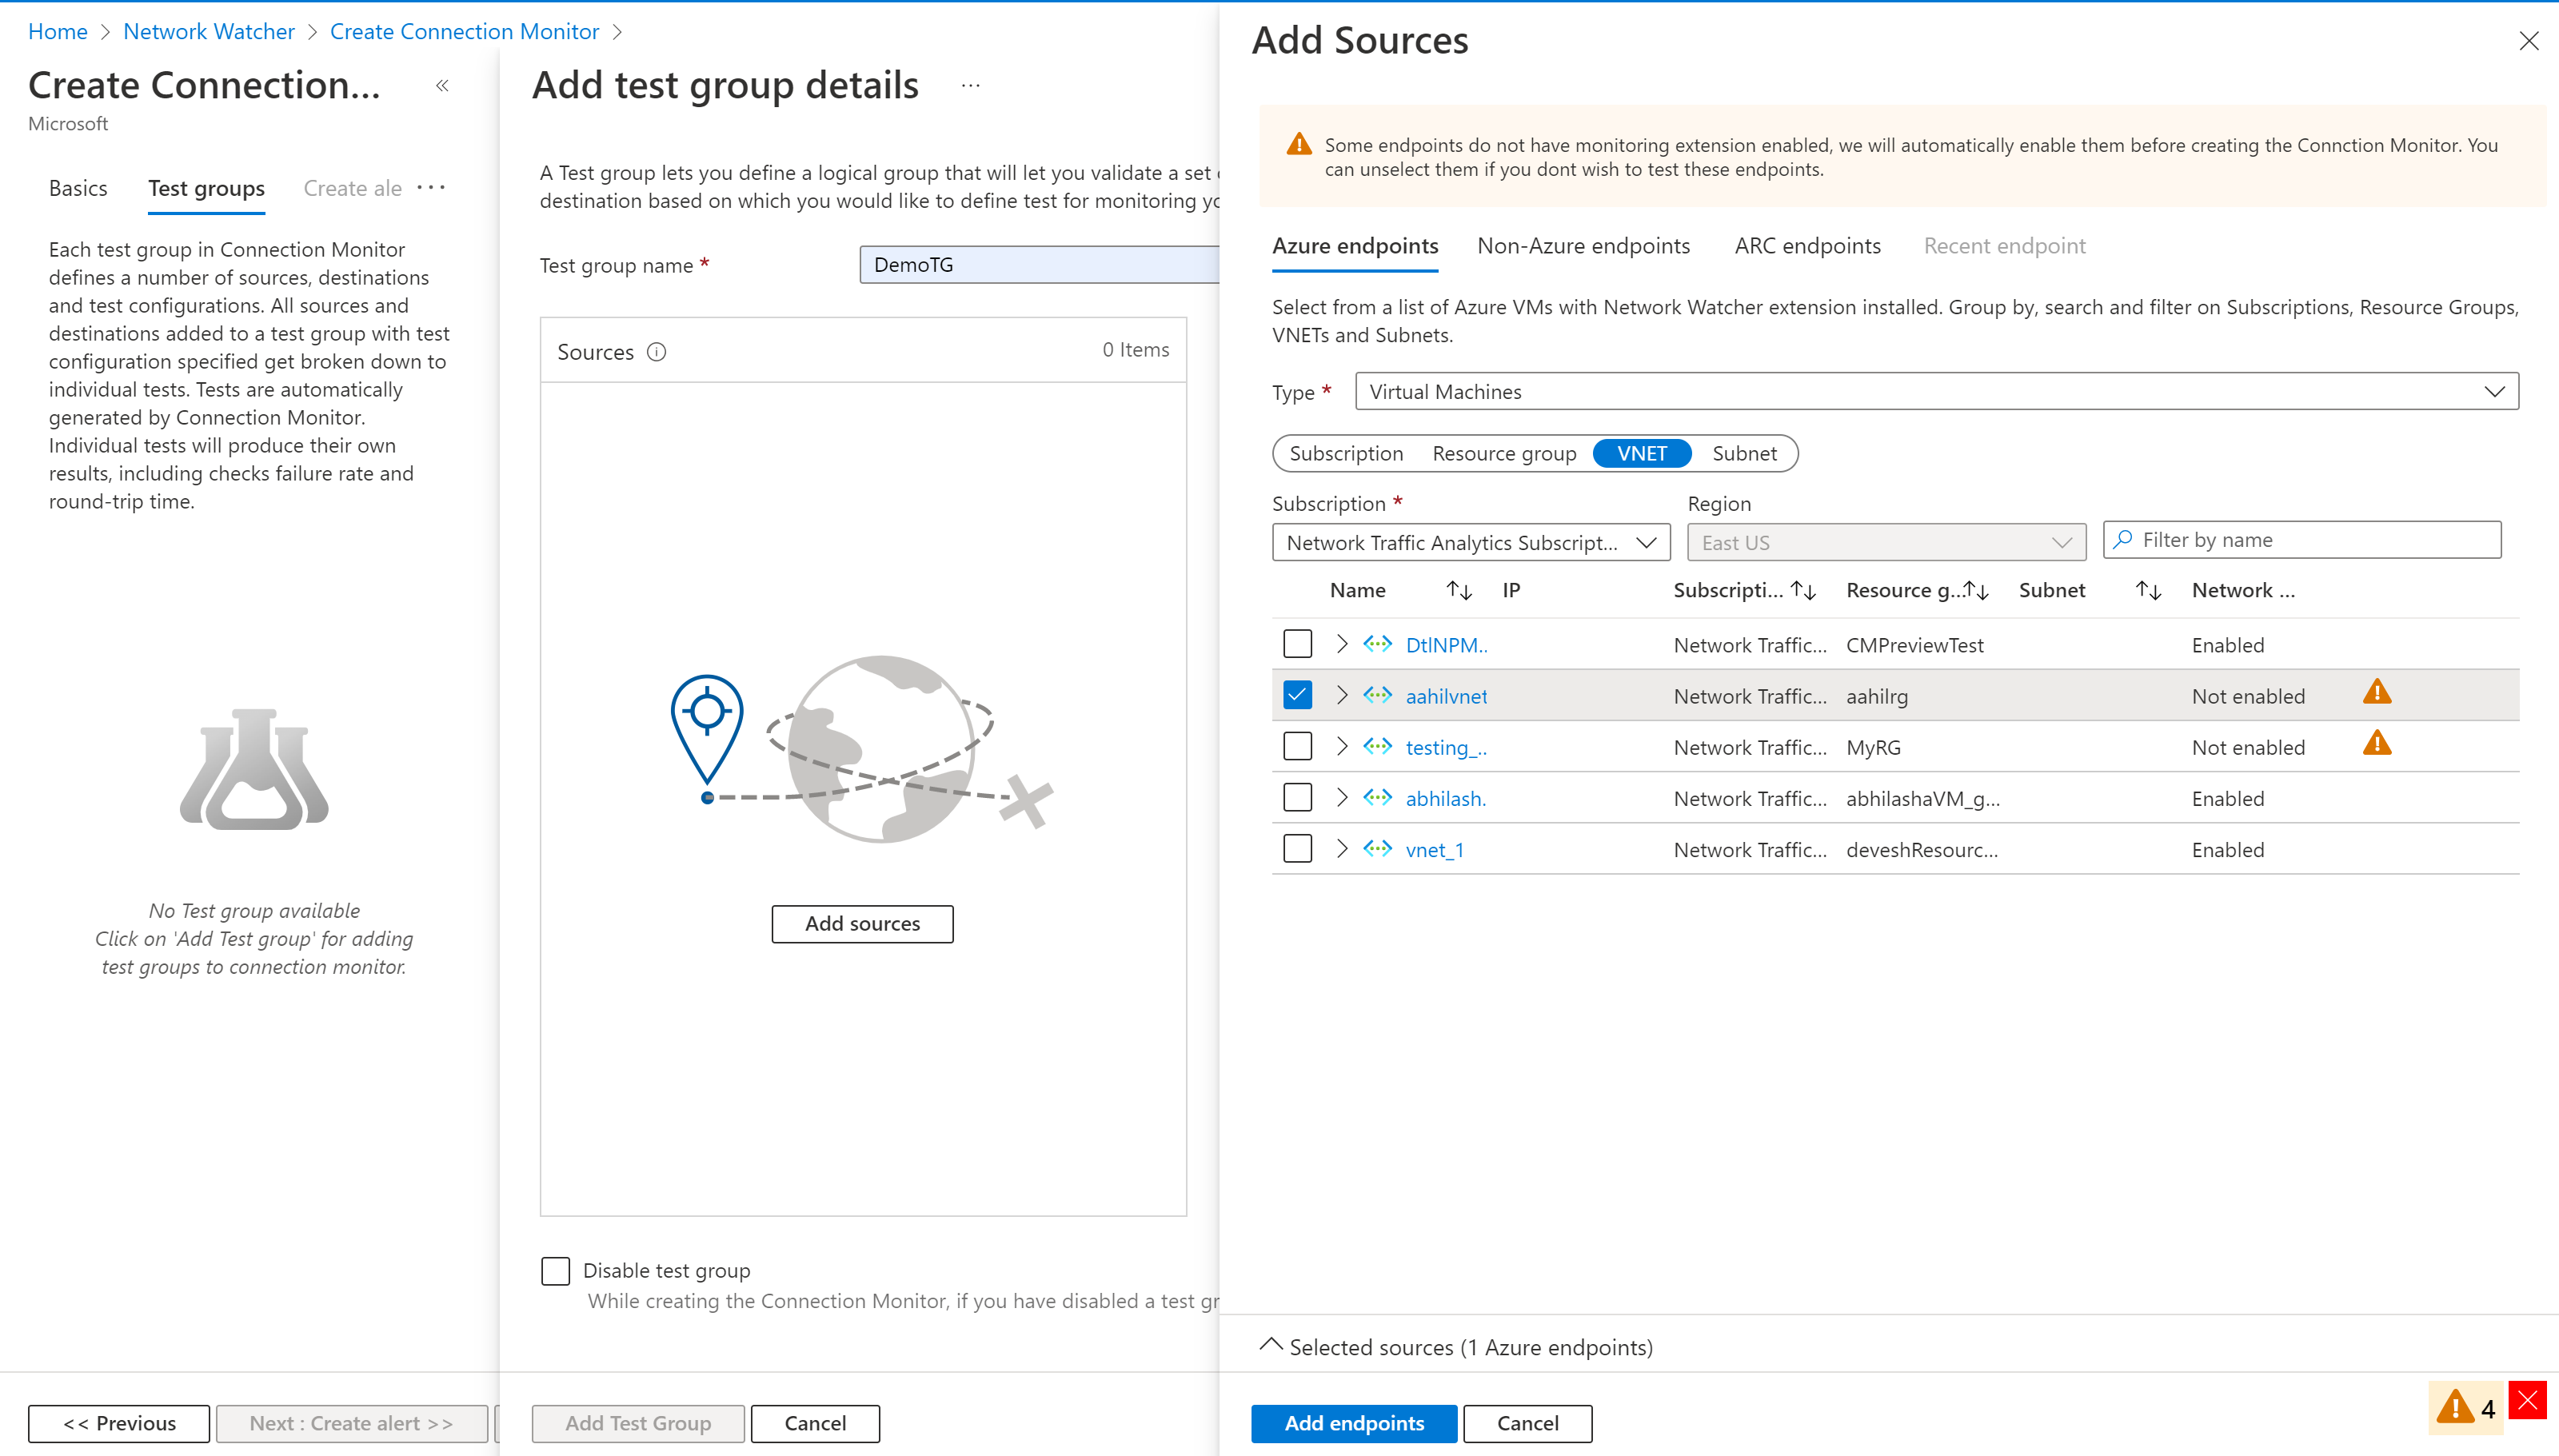
When you finish setting up sources, select Done at the bottom of the pane. You can still edit basic properties such as the endpoint name by selecting the endpoint in the Create Test Group view.
Destinations: You can monitor connectivity to an Azure VM, an on-premises machine, or any endpoint (a public IP, URL, or FQDN) by specifying it as a destination. In a single test group, you can add Azure VMs, on-premises machines, Office 365 URLs, Dynamics 365 URLs, and custom endpoints.
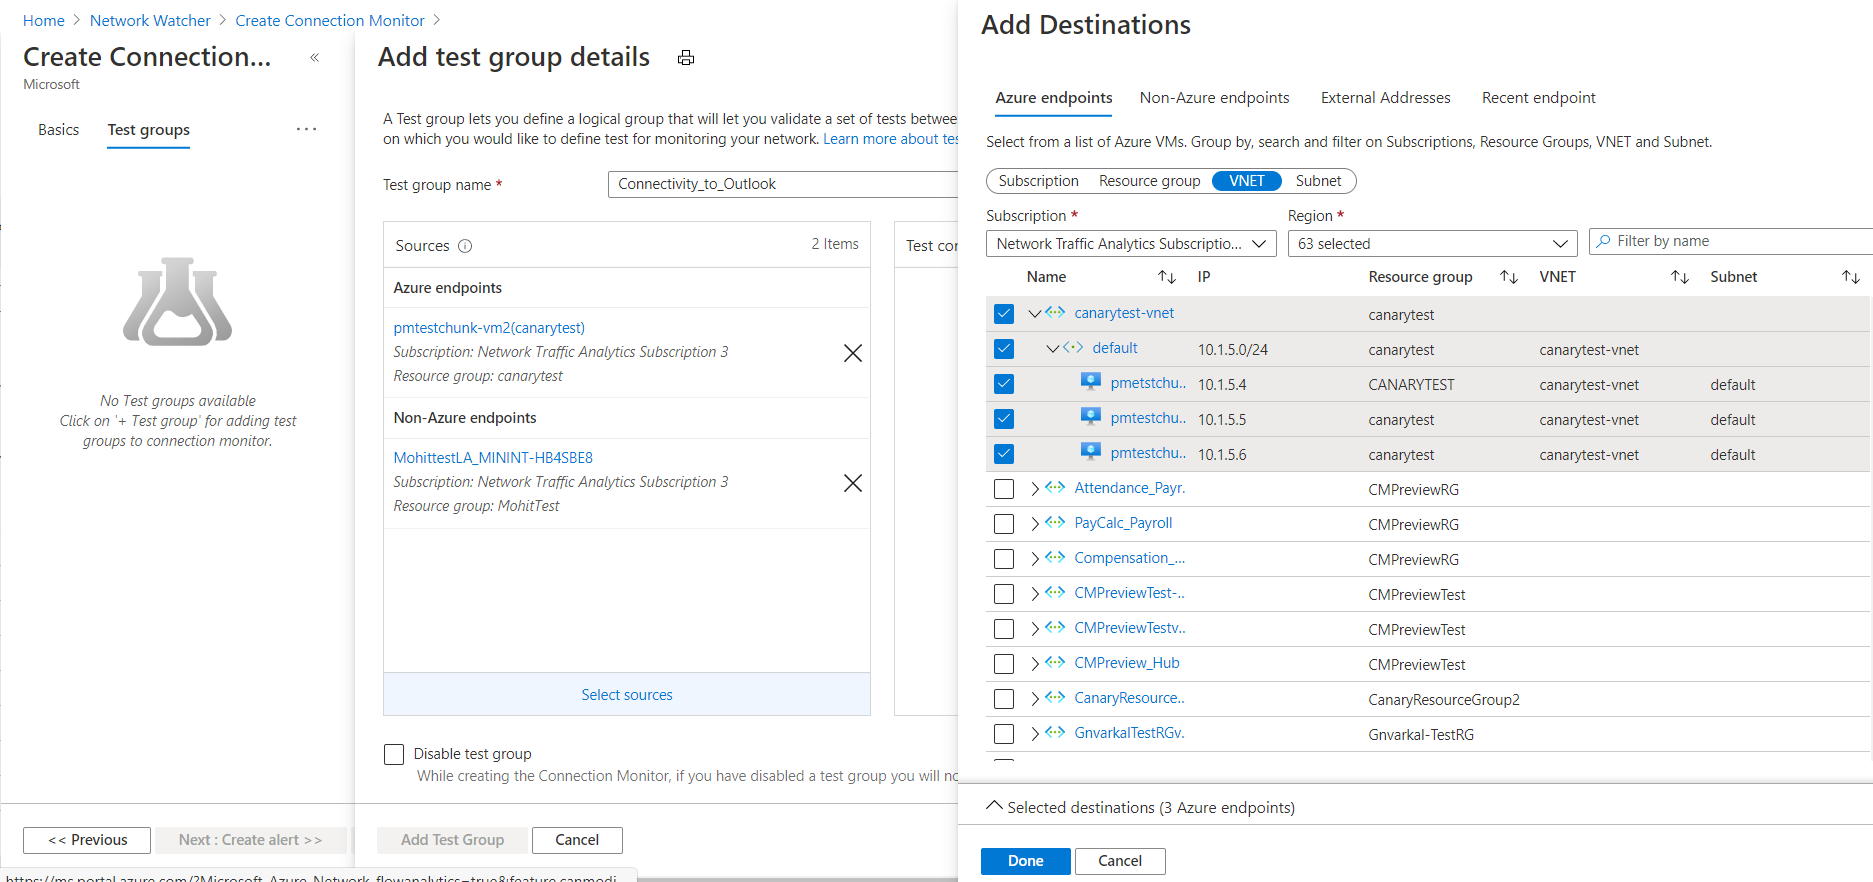
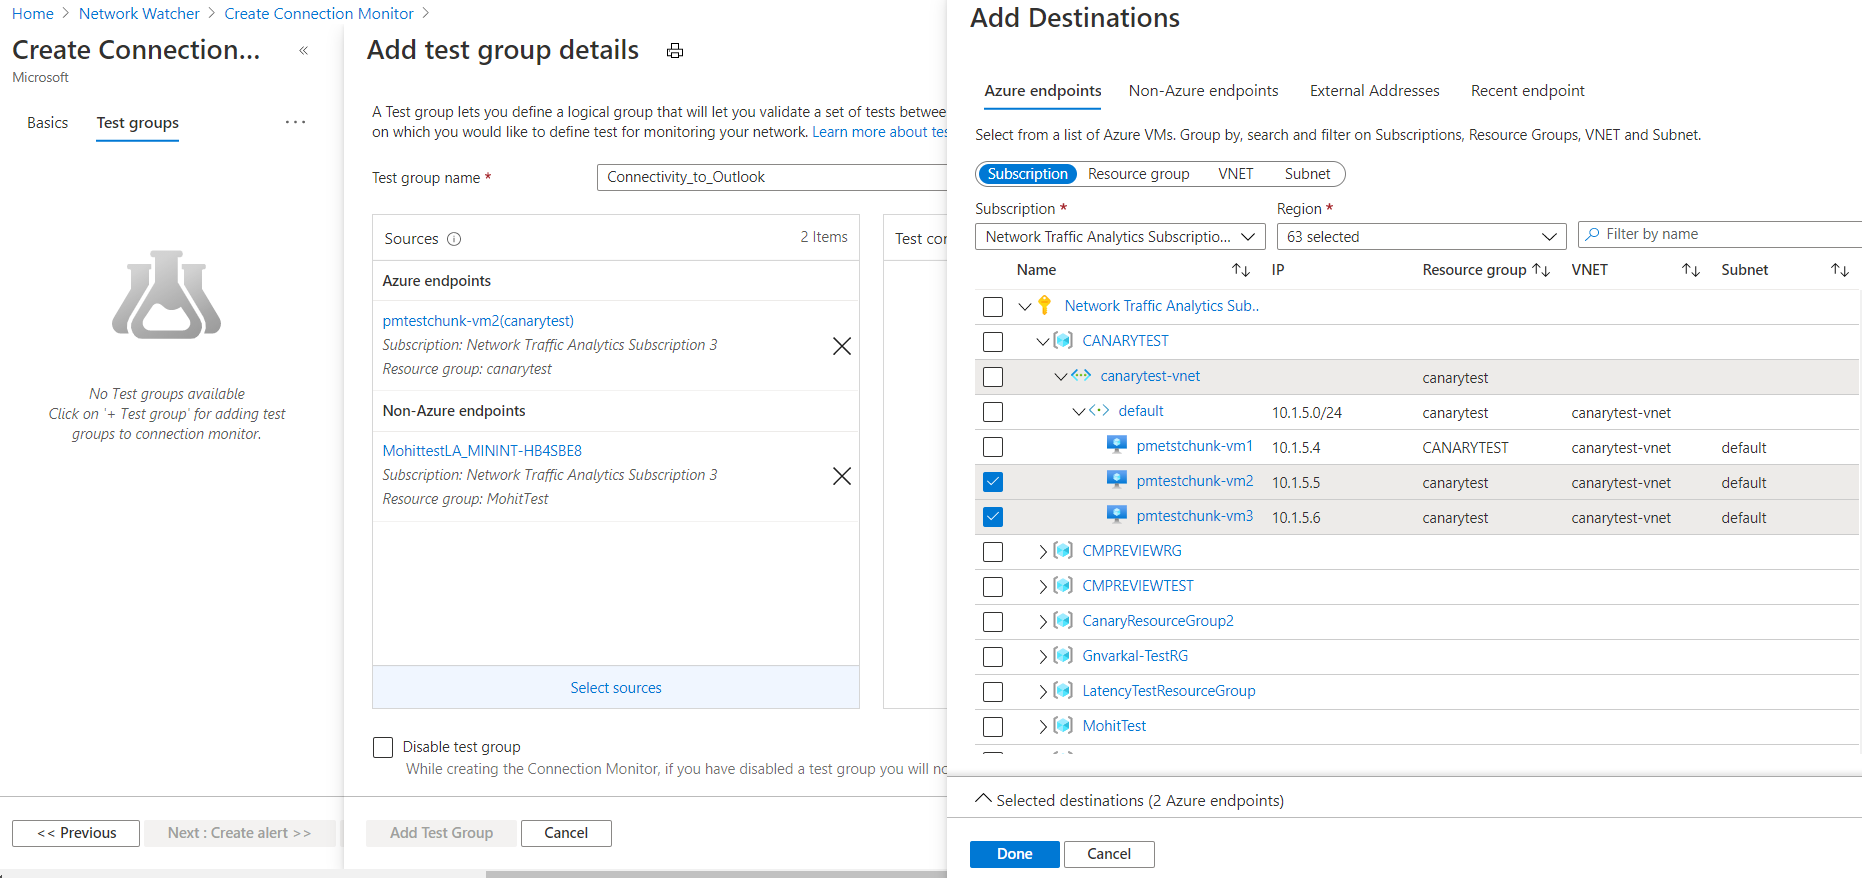
To choose Azure VMs as destinations, select the Azure endpoints tab. By default, the Azure VMs are grouped into a subscription hierarchy that's in the region that you selected under Create Connection Monitor on the Basics pane. You can change the region and choose Azure VMs from the new region. Then you can drill down from the Subscription level to other levels in the hierarchy, just as you can when you set the source Azure endpoints.
You can select virtual networks, subnets, or single VMs, as you can when you set the source Azure endpoints. When you select a virtual network, subnet, or single VM, the corresponding resource ID is set as the endpoint. By default, all VMs in the selected virtual network or subnet that have the Network Watcher extension participate in monitoring. To reduce the scope, either select specific subnets or agents or change the value of the scope property.
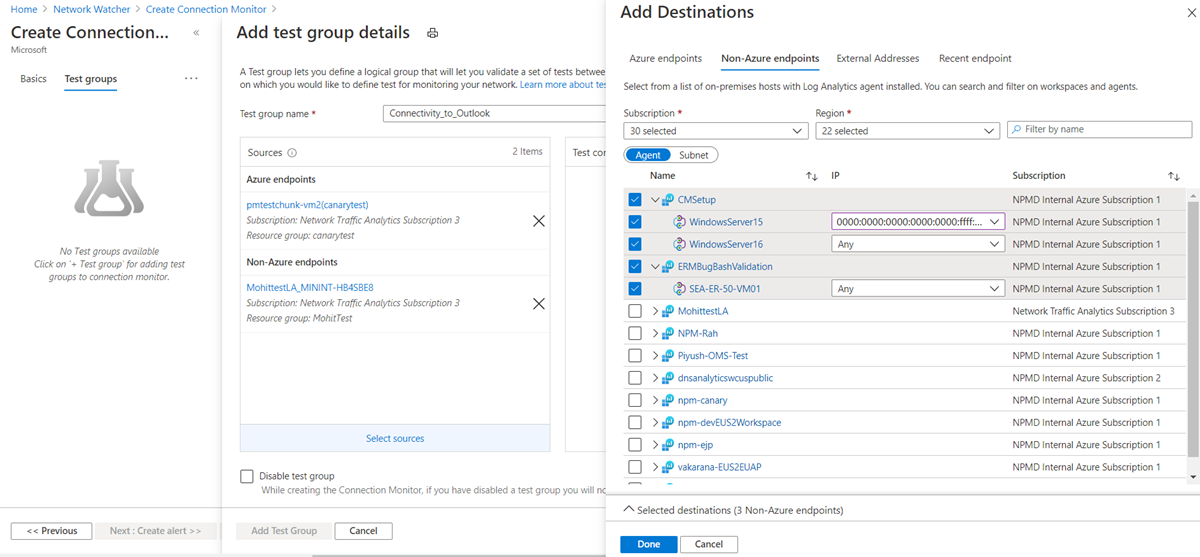
To choose non-Azure agents as destinations, select the Non-Azure endpoints tab. By default, agents are grouped into workspaces by region. All these workspaces have Network Performance Monitor configured.
If you need to add Network Performance Monitor to your workspace, get it from Azure Marketplace. For information about how to add Network Performance Monitor, see Monitoring solutions in Azure Monitor. For information about how to configure agents for on-premises machines, see Monitoring connectivity from on-premises hosts.
Under Create Connection Monitor, on the Basics pane, the default region is selected. If you change the region, you can choose agents from workspaces in the new region. You can select one or more agents or subnets. In the Subnet view, you can select specific IPs for monitoring. If you add multiple subnets, a custom on-premises network named OnPremises_Network_1 will be created.
To choose public endpoints as destinations, select the External Addresses tab. The list of endpoints includes Office 365 test URLs and Dynamics 365 test URLs, grouped by name. You also can choose endpoints that were created in other test groups in the same connection monitor.
To add an endpoint, at the upper right, select Add Endpoint, and then provide an endpoint name and URL, IP, or FQDN.
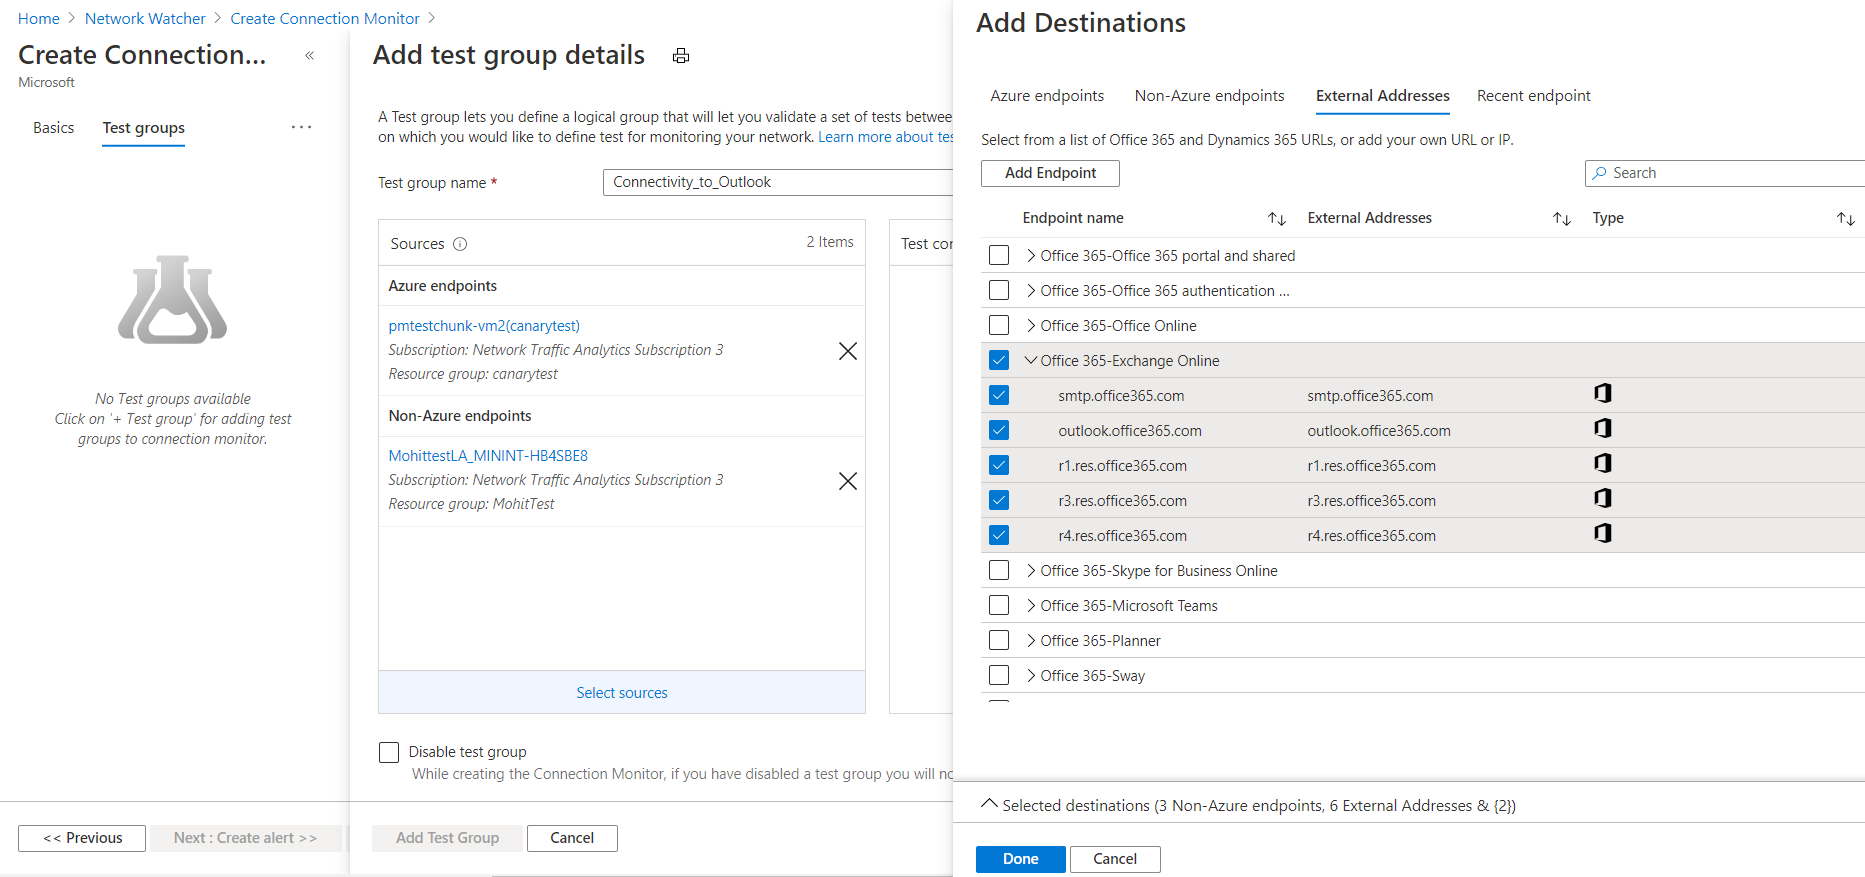
To choose recently used endpoints, go to the Recent endpoint pane.
When you finish choosing destinations, select Done. You can still edit basic properties such as the endpoint name by selecting the endpoint in the Create Test Group view.
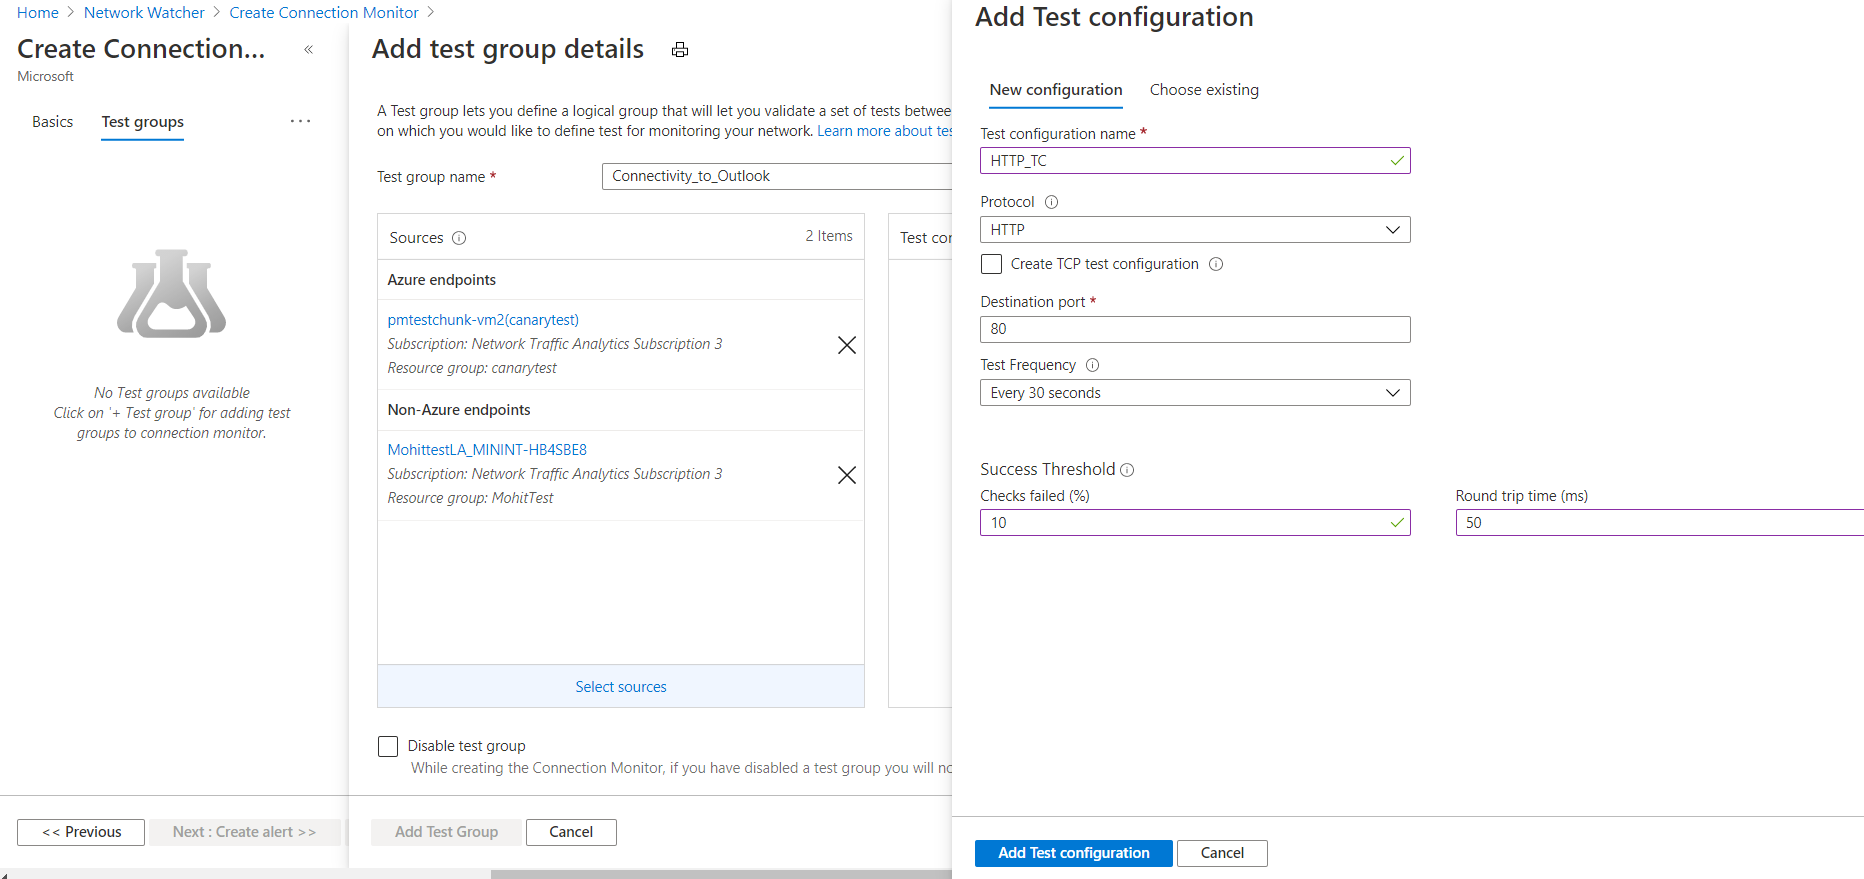
Test configurations: You can add one or more test configurations to a test group. Create a new test configuration by using the New configuration tab. Or add a test configuration from another test group in the same connection monitor from the Choose existing pane.
- Test configuration name: Name the test configuration.
- Protocol: Select TCP, ICMP, or HTTP. To change HTTP to HTTPS, select HTTP as the protocol and then select 443 as the port.
- Create TCP test configuration: This checkbox appears only if you select HTTP in the Protocol list. Select this checkbox to create another test configuration that uses the same sources and destinations that you specified elsewhere in your configuration. The new test configuration is named <name of test configuration>_networkTestConfig.
- Disable traceroute: This checkbox applies when the protocol is TCP or ICMP. Select this box to stop sources from discovering topology and hop-by-hop RTT.
- Destination port: You can provide a destination port of your choice.
- Listen on port: This checkbox applies when the protocol is TCP. Select this checkbox to open the chosen TCP port if it's not already open. This feature won't work if source and destination machines are in different regions.
- Test Frequency: In this list, specify how frequently sources will ping destinations on the protocol and port that you specified. You can choose 30 seconds, 1 minute, 5 minutes, 15 minutes, or 30 minutes. Select custom to enter another frequency from 30 seconds to 30 minutes. Sources will test connectivity to destinations based on the value that you choose. For example, if you select 30 seconds, sources will check connectivity to the destination at least once in every 30-second period.
- Success Threshold: You can set thresholds on the following network elements:
- Checks failed: Set the percentage of checks that can fail when sources check connectivity to destinations by using the criteria that you specified. For the TCP or ICMP protocol, the percentage of failed checks can be equated to the percentage of packet loss. For HTTP protocol, this value represents the percentage of HTTP requests that received no response.
- Round trip time: Set the RTT, in milliseconds, for how long sources can take to connect to the destination over the test configuration.
Test Groups: You can add one or more test groups to a connection monitor. These test groups can consist of multiple Azure or non-Azure endpoints.
- For selected Azure VMs or Azure Virtual Machine Scale Sets and non-Azure endpoints without monitoring extensions, the extension for Azure VMs and the npm solution for non-Azure endpoints will be auto enabled after the creation of the connection monitor begins.
- If the selected virtual machine scale set is set for a manual upgrade, you'll have to upgrade the scale set after Network Watcher extension installation to continue setting up the connection monitor with virtual machine scale set as endpoints. If the virtual machine scale set is set to auto upgrade, you don't need to worry about any upgrading after the Network Watcher extension is installed.
- In the previously mentioned scenario, you can consent to an auto upgrade of a virtual machine scale set with auto enabling of the Network Watcher extension during the creation of the connection monitor for Virtual Machine Scale Sets with manual upgrading. This would eliminate having to manually upgrade the virtual machine scale set after you install the Network Watcher extension.

Disable test group: You can select this checkbox to disable monitoring for all sources and destinations that the test group specifies. This checkbox is cleared by default.
Create alerts for a connection monitor
You can set up alerts on tests that are failing, based on the thresholds set in the test configurations.
In the Azure portal, to create alerts for a connection monitor, specify values for these fields:
Create alert: You can select this checkbox to create a metric alert in Azure Monitor. When you select this checkbox, the other fields are enabled for editing. Additional charges for the alert will be applicable, based on the pricing for alerts.
Scope > Resource > Hierarchy: These values are automatically entered, based on the values specified on the Basics pane.
Condition name: The alert is created on the
Test Result(preview)metric. When the connection monitor test fails, the alert rule will fire.Action group name: You can enter your email directly, or you can create alerts via action groups. If you enter your email directly, an action group with the name NPM Email ActionGroup is created. The email ID is added to that action group. If you choose to use action groups, you need to select a previously created action group. To learn how to create an action group, see Create action groups in the Azure portal. After the alert is created, you can manage your alerts.
Alert rule name: The name of the connection monitor.
Enable rule upon creation: Select this checkbox to enable the alert rule, based on the condition. Disable this checkbox if you want to create the rule without enabling it.
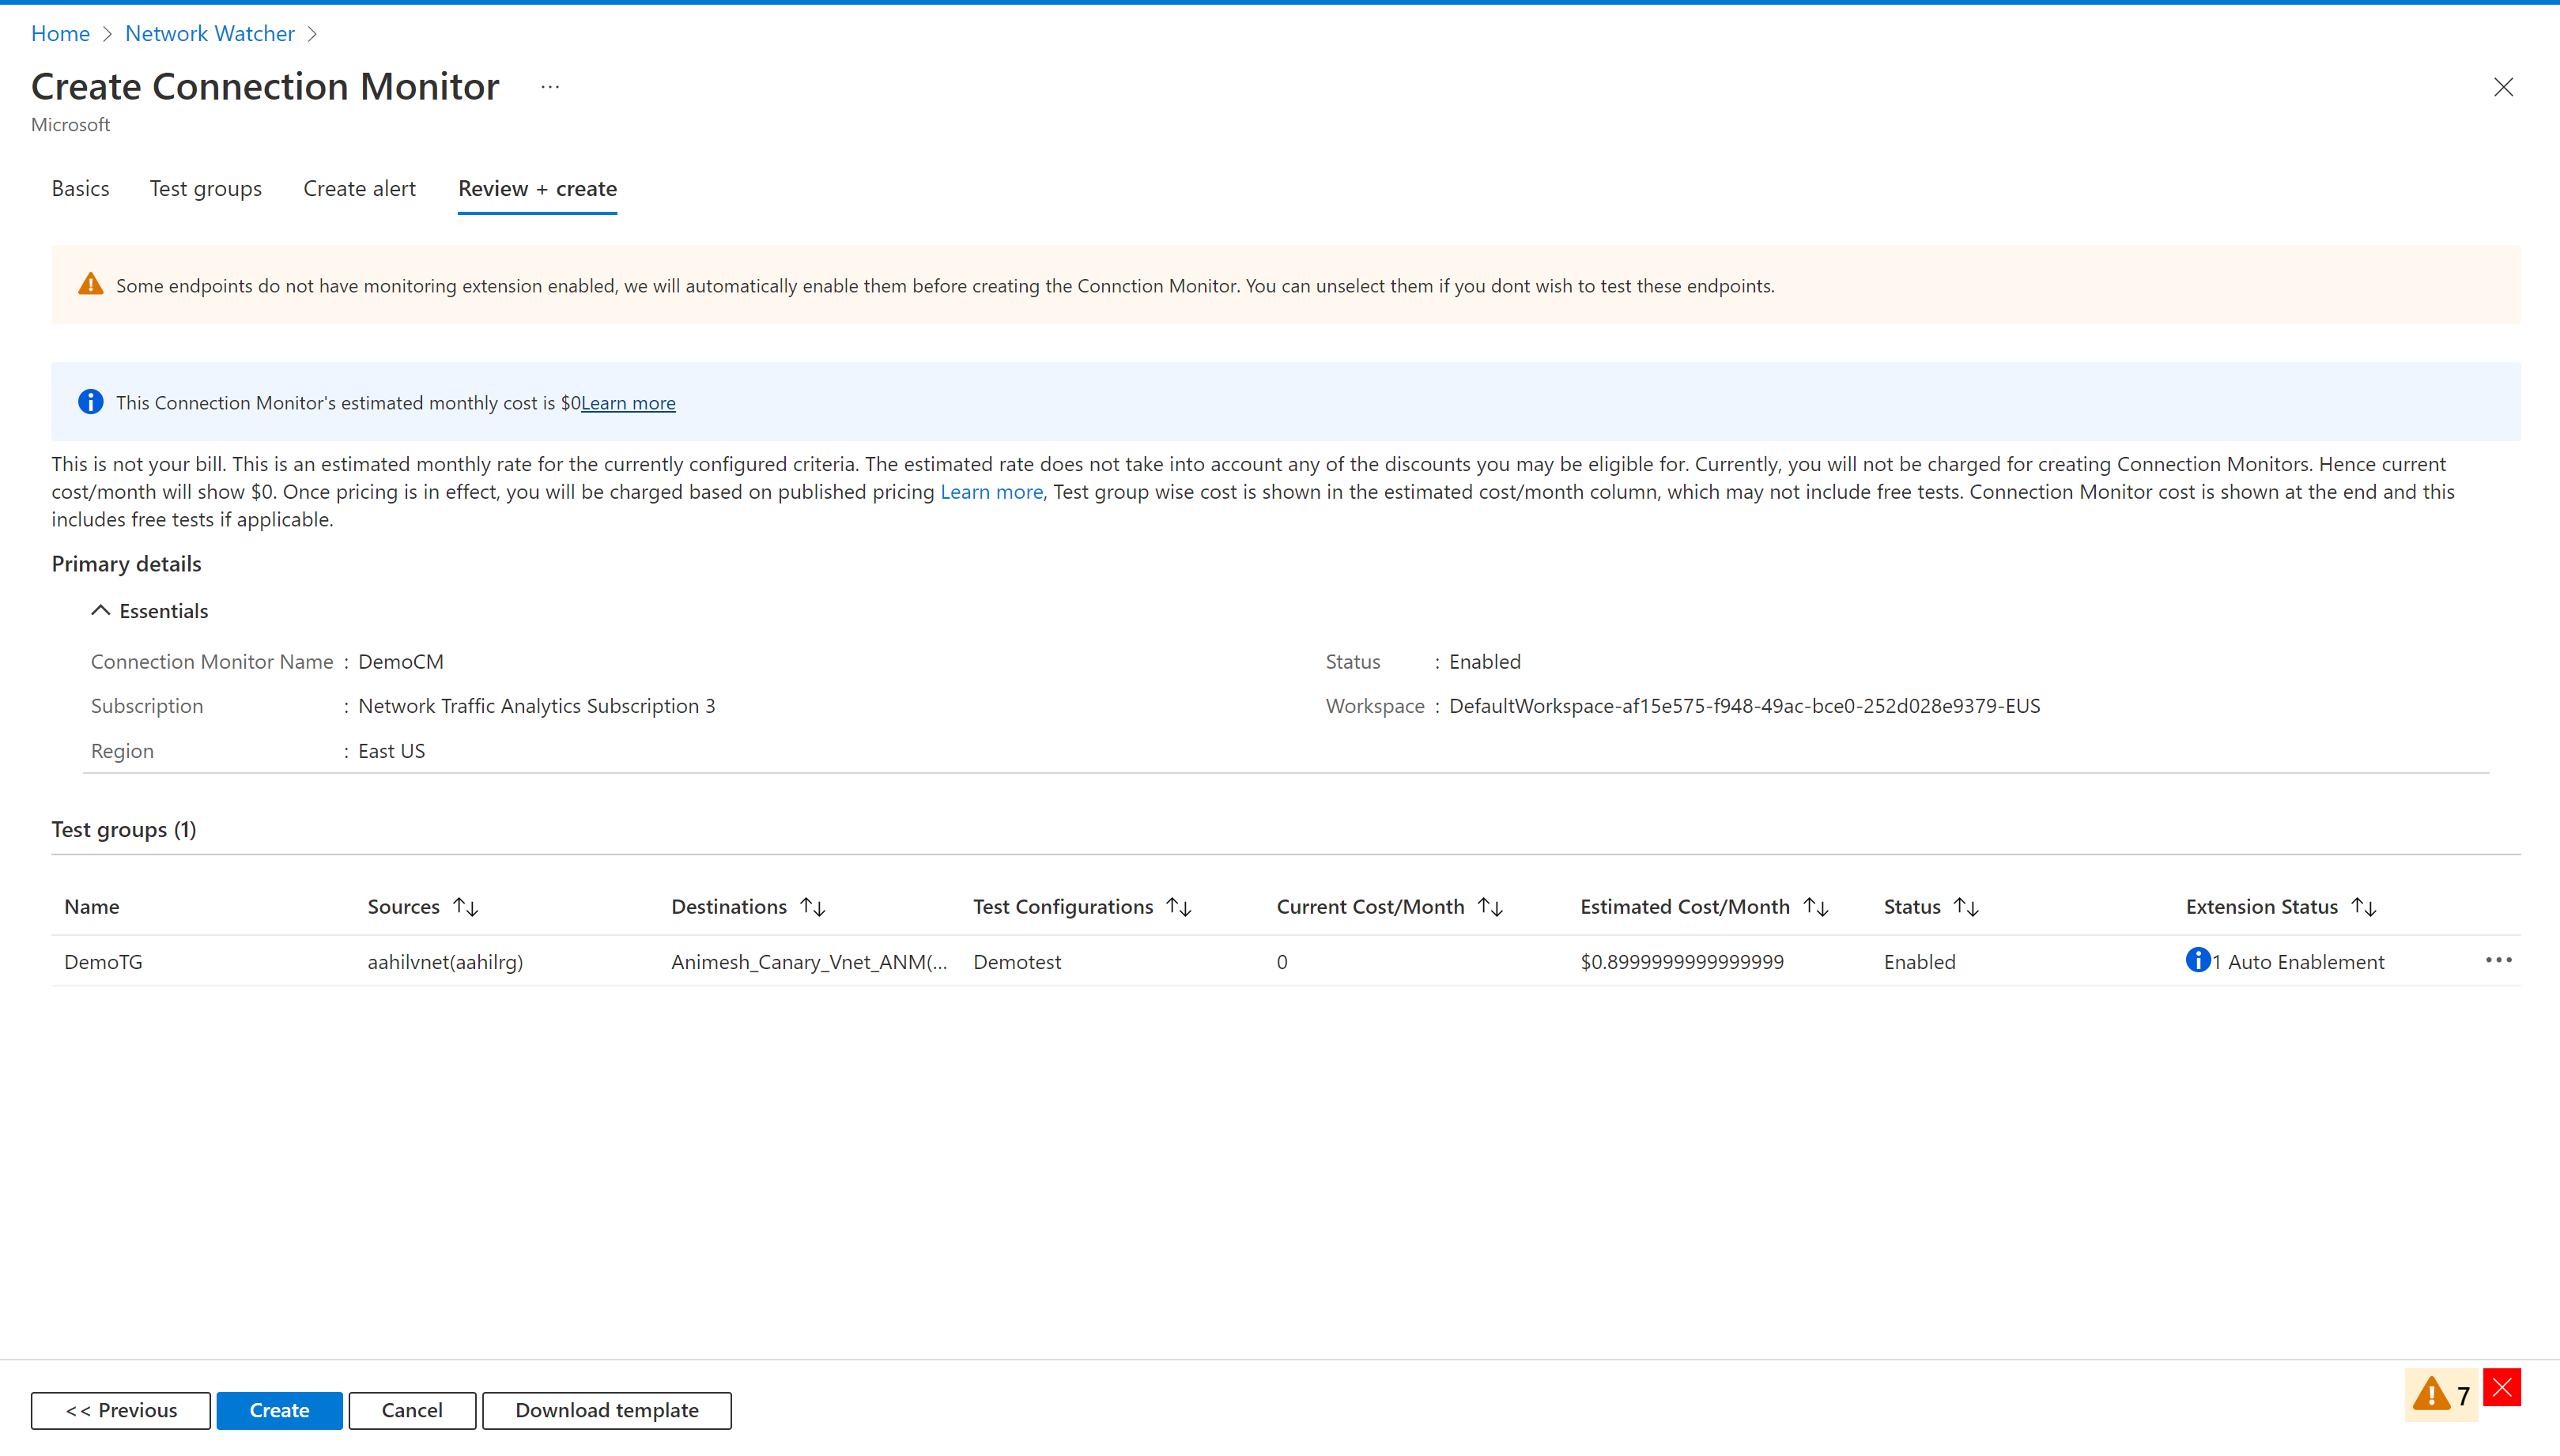
After you've completed all the steps, the process will proceed with unified enablement of monitoring extensions for all endpoints without monitoring agents enabled, followed by the creation of the connection monitor.
After the creation process is successful, it takes about 5 minutes for the connection monitor to be displayed on the dashboard.
Scale limits
Connection monitors have these scale limits:
- Maximum connection monitors per subscription per region: 100
- Maximum test groups per connection monitor: 20
- Maximum sources and destinations per connection monitor: 100
- Maximum test configurations per connection monitor: 2 via the Azure portal