Monitor and collect data from ML web service endpoints
APPLIES TO:  Python SDK azureml v1
In this article, you learn how to collect data from models deployed to web service endpoints in Azure Kubernetes Service (AKS) or Azure Container Instances (ACI). Use Azure Application Insights to collect the following data from an endpoint:
- Output data
- Responses
- Request rates, response times, and failure rates
- Dependency rates, response times, and failure rates
- Exceptions
The enable-app-insights-in-production-service.ipynb notebook demonstrates concepts in this article.
Learn how to run notebooks by following the article Use Jupyter notebooks to explore this service.
Important
The information in this article relies on the Azure Application Insights instance that was created with your workspace. If you deleted this Application Insights instance, there is no way to re-create it other than deleting and recreating the workspace.
Tip
If you are using online endpoints instead, use the information in the Monitor online endpoints article instead.
Prerequisites
An Azure subscription - try the free or paid version of Azure Machine Learning.
An Azure Machine Learning workspace, a local directory that contains your scripts, and the Azure Machine Learning SDK for Python installed. To learn more, see How to configure a development environment.
A trained machine learning model. To learn more, see the Train image classification model tutorial.
Configure logging with the Python SDK
In this section, you learn how to enable Application Insight logging by using the Python SDK.
Update a deployed service
Use the following steps to update an existing web service:
Identify the service in your workspace. The value for
wsis the name of your workspacefrom azureml.core.webservice import Webservice aks_service= Webservice(ws, "my-service-name")Update your service and enable Azure Application Insights
aks_service.update(enable_app_insights=True)
Log custom traces in your service
Important
Azure Application Insights only logs payloads of up to 64kb. If this limit is reached, you may see errors such as out of memory, or no information may be logged. If the data you want to log is larger 64kb, you should instead store it to blob storage using the information in Collect Data for models in production.
For more complex situations, like model tracking within an AKS deployment, we recommend using a third-party library like OpenCensus.
To log custom traces, follow the standard deployment process for AKS or ACI in the How to deploy and where document. Then, use the following steps:
Update the scoring file by adding print statements to send data to Application Insights during inference. For more complex information, such as the request data and the response, use a JSON structure.
The following example
score.pyfile logs when the model was initialized, input and output during inference, and the time any errors occur.import pickle import json import numpy from sklearn.externals import joblib from sklearn.linear_model import Ridge from azureml.core.model import Model import time def init(): global model #Print statement for appinsights custom traces: print ("model initialized" + time.strftime("%H:%M:%S")) # note here "sklearn_regression_model.pkl" is the name of the model registered under the workspace # this call should return the path to the model.pkl file on the local disk. model_path = Model.get_model_path(model_name = 'sklearn_regression_model.pkl') # deserialize the model file back into a sklearn model model = joblib.load(model_path) # note you can pass in multiple rows for scoring def run(raw_data): try: data = json.loads(raw_data)['data'] data = numpy.array(data) result = model.predict(data) # Log the input and output data to appinsights: info = { "input": raw_data, "output": result.tolist() } print(json.dumps(info)) # you can return any datatype as long as it is JSON-serializable return result.tolist() except Exception as e: error = str(e) print (error + time.strftime("%H:%M:%S")) return errorUpdate the service configuration, and make sure to enable Application Insights.
config = Webservice.deploy_configuration(enable_app_insights=True)Build an image and deploy it on AKS or ACI. For more information, see How to deploy and where.
Disable tracking in Python
To disable Azure Application Insights, use the following code:
## replace <service_name> with the name of the web service
<service_name>.update(enable_app_insights=False)
Configure logging with Azure Machine Learning studio
You can also enable Azure Application Insights from Azure Machine Learning studio. When you're ready to deploy your model as a web service, use the following steps to enable Application Insights:
Sign in to the studio at https://ml.azure.com.
Go to Models and select the model you want to deploy.
Select +Deploy.
Populate the Deploy model form.
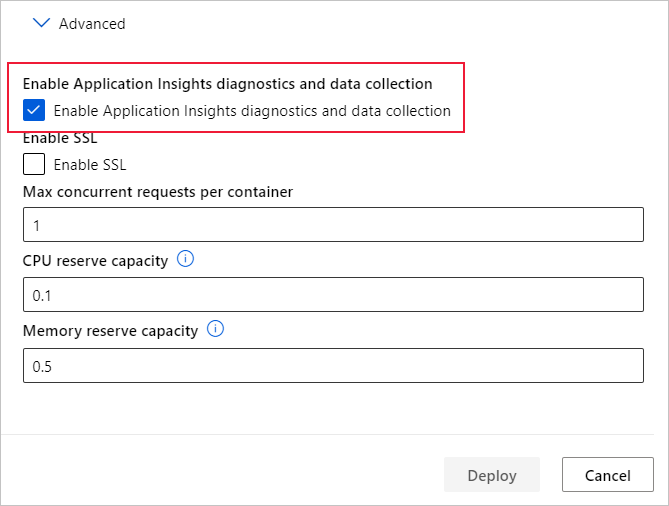
Expand the Advanced menu.
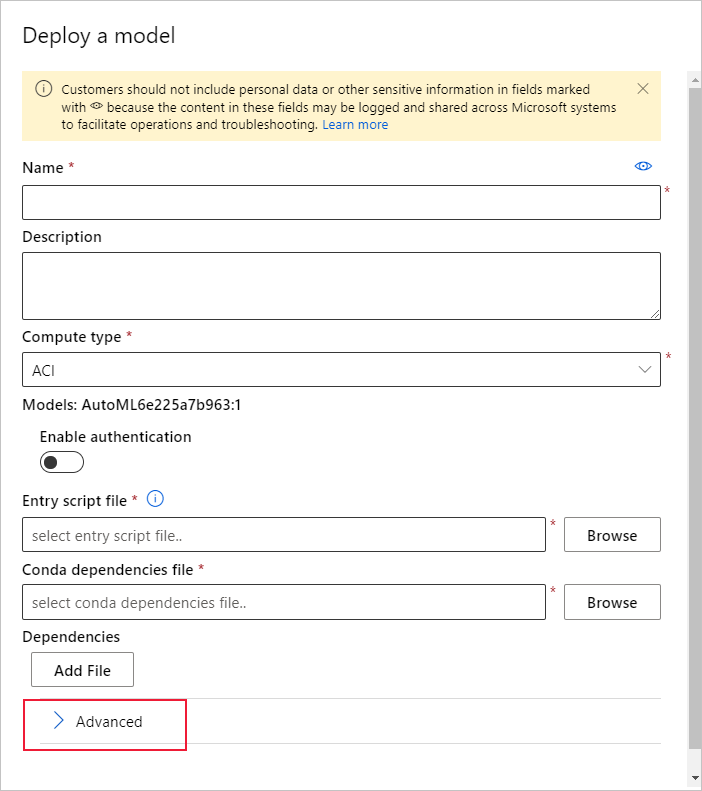
Select Enable Application Insights diagnostics and data collection.
View metrics and logs
Query logs for deployed models
Logs of online endpoints are customer data. You can use the get_logs() function to retrieve logs from a previously deployed web service. The logs may contain detailed information about any errors that occurred during deployment.
from azureml.core import Workspace
from azureml.core.webservice import Webservice

ws = Workspace.from_config()

# load existing web service
service = Webservice(name="service-name", workspace=ws)
logs = service.get_logs()
If you have multiple Tenants, you might need to add the following authenticate code before ws = Workspace.from_config()
from azureml.core.authentication import InteractiveLoginAuthentication
interactive_auth = InteractiveLoginAuthentication(tenant_id="the tenant_id in which your workspace resides")
View logs in the studio
Azure Application Insights stores your service logs in the same resource group as the Azure Machine Learning workspace. Use the following steps to view your data using the studio:
Go to your Azure Machine Learning workspace in the studio.
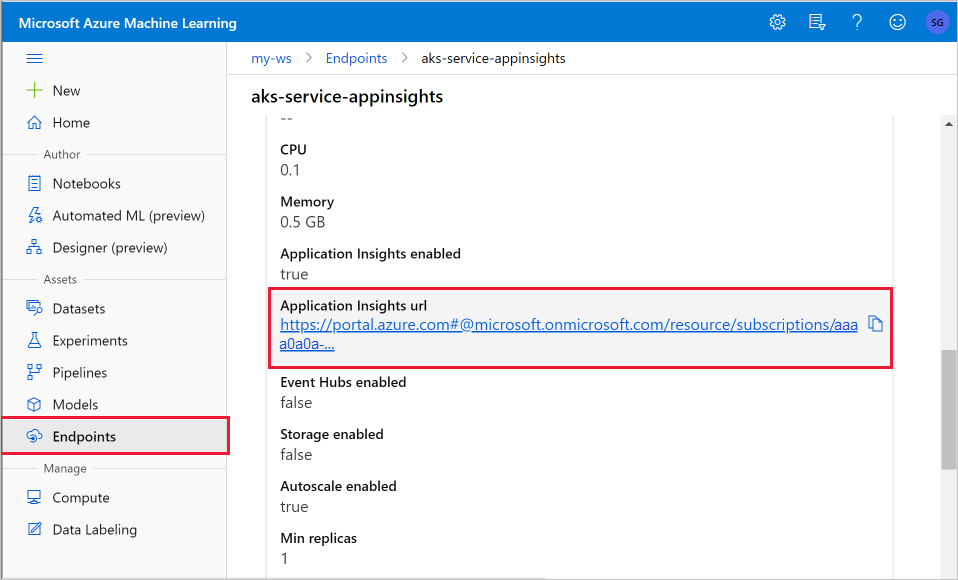
Select Endpoints.
Select the deployed service.
Select the Application Insights url link.
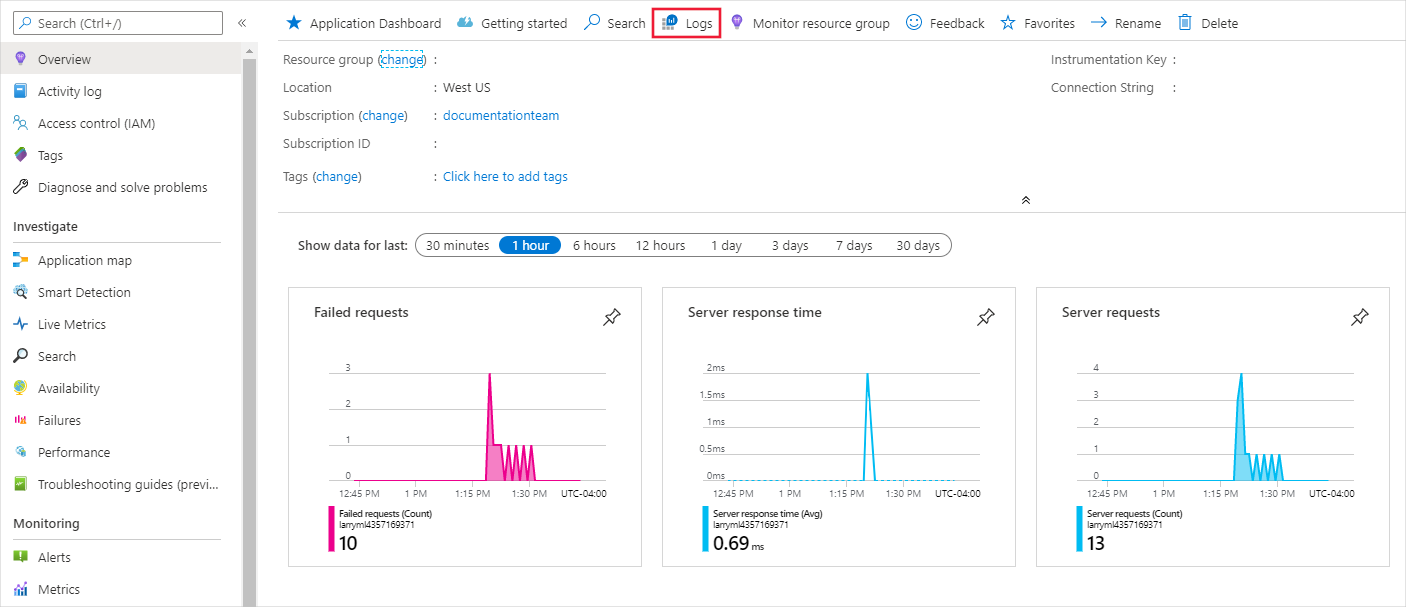
In Application Insights, from the Overview tab or the Monitoring section, select Logs.
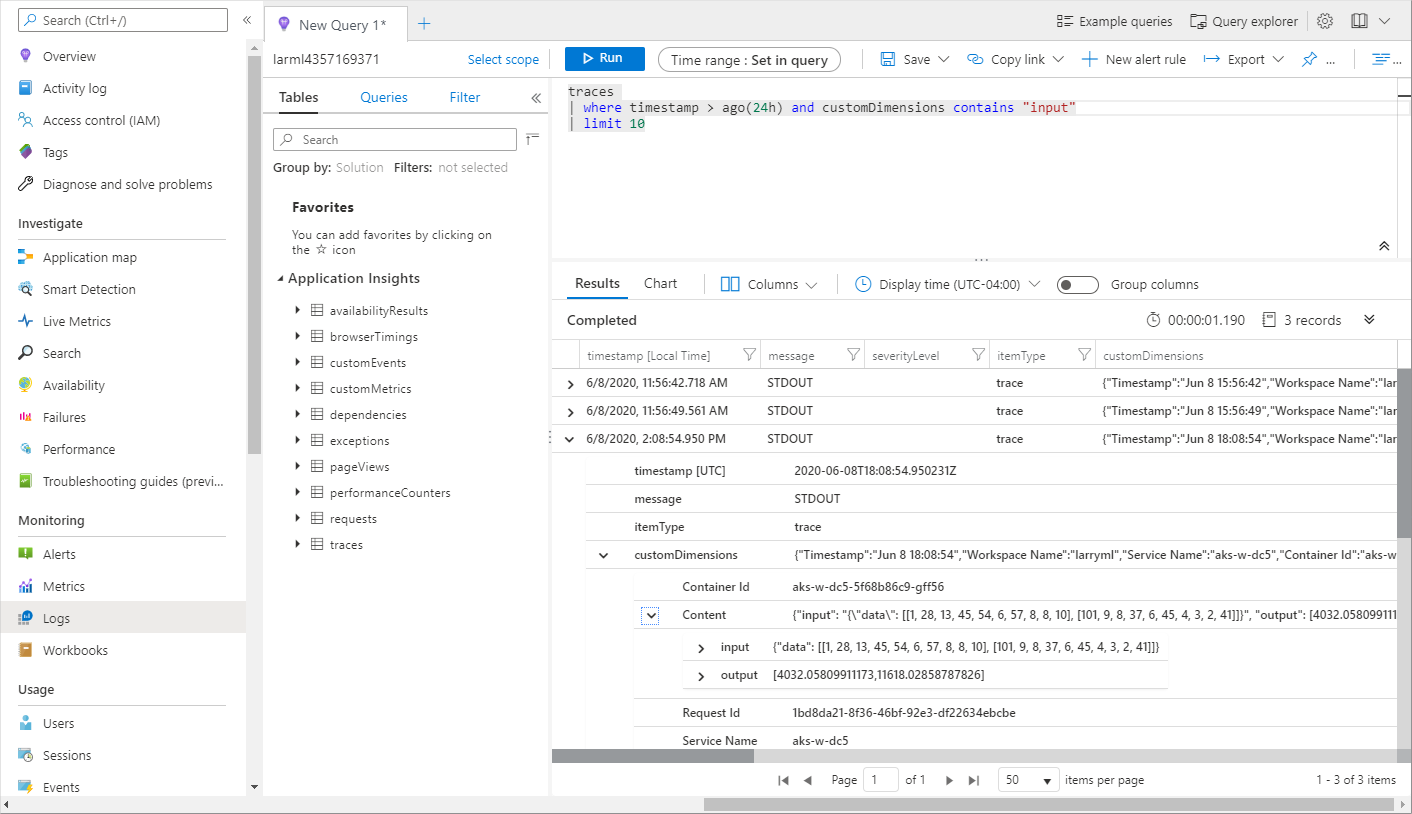
To view information logged from the score.py file, look at the traces table. The following query searches for logs where the input value was logged:
traces
| where customDimensions contains "input"
| limit 10
For more information on how to use Azure Application Insights, see What is Application Insights?.
Web service metadata and response data
Important
Azure Application Insights only logs payloads of up to 64kb. If this limit is reached then you may see errors such as out of memory, or no information may be logged.
To log web service request information, add print statements to your score.py file. Each print statement results in one entry in the Application Insights trace table under the message STDOUT. Application Insights stores the print statement outputs in customDimensions and in the Contents trace table. Printing JSON strings produces a hierarchical data structure in the trace output under Contents.
Export data for retention and processing
Important
Azure Application Insights only supports exports to blob storage. For more information on the limits of this implementation, see Export telemetry from App Insights.
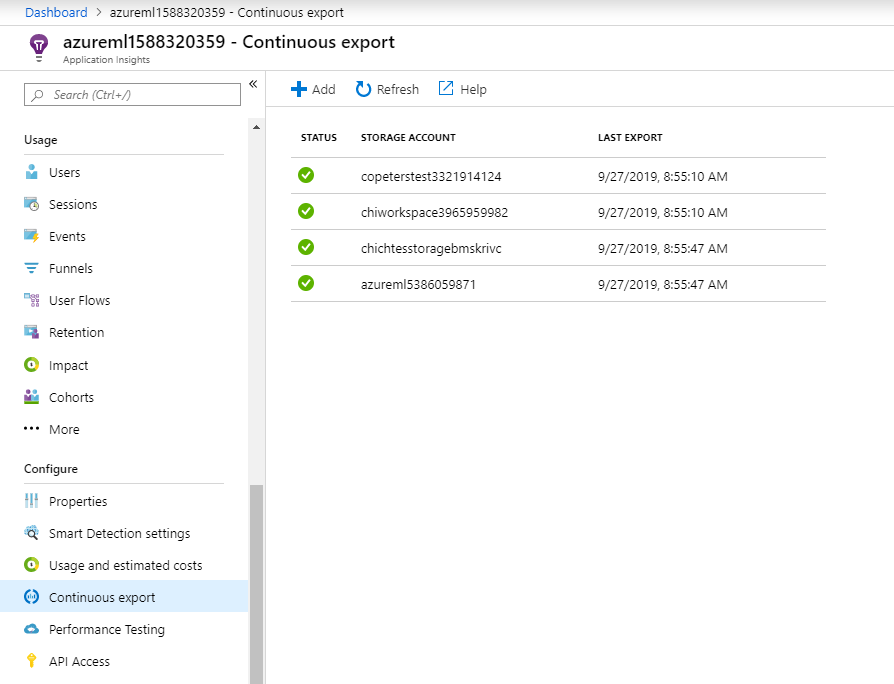
Use Application Insights' continuous export to export data to a blob storage account where you can define retention settings. Application Insights exports the data in JSON format.
Next steps
In this article, you learned how to enable logging and view logs for web service endpoints. Try these articles for next steps:
MLOps: Manage, deploy, and monitor models with Azure Machine Learning to learn more about leveraging data collected from models in production. Such data can help to continually improve your machine learning process.
