Troubleshooting the ParallelRunStep
APPLIES TO:  Python SDK azureml v1
In this article, you learn how to troubleshoot when you get errors using the ParallelRunStep class from the Azure Machine Learning SDK.
For general tips on troubleshooting a pipeline, see Troubleshooting machine learning pipelines.
Testing scripts locally
Your ParallelRunStep runs as a step in ML pipelines. You might want to test your scripts locally as a first step.
Entry script requirements
The entry script for a ParallelRunStep must contain a run() function and optionally contains an init() function:
init(): Use this function for any costly or common preparation for later processing. For example, use it to load the model into a global object. This function is called only once at beginning of process.Note
If your
initmethod creates an output directory, specify thatparents=Trueandexist_ok=True. Theinitmethod is called from each worker process on every node on which the job is running.run(mini_batch): The function runs for eachmini_batchinstance.mini_batch:ParallelRunStepinvokes run method and pass either a list or pandasDataFrameas an argument to the method. Each entry in mini_batch can be a file path if input is aFileDatasetor a pandasDataFrameif input is aTabularDataset.response: run() method should return a pandasDataFrameor an array. For append_row output_action, these returned elements are appended into the common output file. For summary_only, the contents of the elements are ignored. For all output actions, each returned output element indicates one successful run of input element in the input mini-batch. Make sure that enough data is included in run result to map input to run output result. Run outputs are written in output file and not guaranteed to be in order, you should use some key in the output to map it to input.Note
One output element is expected for one input element.
%%writefile digit_identification.py
# Snippets from a sample script.
# Refer to the accompanying digit_identification.py
# (https://github.com/Azure/MachineLearningNotebooks/tree/master/how-to-use-azureml/machine-learning-pipelines/parallel-run)
# for the implementation script.

import os
import numpy as np
import tensorflow as tf
from PIL import Image
from azureml.core import Model


def init():
    global g_tf_sess

    # Pull down the model from the workspace
    model_path = Model.get_model_path("mnist")

    # Construct a graph to execute
    tf.reset_default_graph()
    saver = tf.train.import_meta_graph(os.path.join(model_path, 'mnist-tf.model.meta'))
    g_tf_sess = tf.Session()
    saver.restore(g_tf_sess, os.path.join(model_path, 'mnist-tf.model'))


def run(mini_batch):
    print(f'run method start: {__file__}, run({mini_batch})')
    resultList = []
    in_tensor = g_tf_sess.graph.get_tensor_by_name("network/X:0")
    output = g_tf_sess.graph.get_tensor_by_name("network/output/MatMul:0")

    for image in mini_batch:
        # Prepare each image
        data = Image.open(image)
        np_im = np.array(data).reshape((1, 784))
        # Perform inference
        inference_result = output.eval(feed_dict={in_tensor: np_im}, session=g_tf_sess)
        # Find the best probability, and add it to the result list
        best_result = np.argmax(inference_result)
        resultList.append("{}: {}".format(os.path.basename(image), best_result))

    return resultList
If you have another file or folder in the same directory as your inference script, you can reference it by finding the current working directory. If you want to import your packages, you can also append your package folder to sys.path.
script_dir = os.path.realpath(os.path.join(__file__, '..',))
file_path = os.path.join(script_dir, "<file_name>")

packages_dir = os.path.join(file_path, '<your_package_folder>')
if packages_dir not in sys.path:
    sys.path.append(packages_dir)
from <your_package> import <your_class>
Parameters for ParallelRunConfig
ParallelRunConfig is the major configuration for ParallelRunStep instance within the Azure Machine Learning pipeline. You use it to wrap your script and configure necessary parameters, including all of the following entries:
entry_script: A user script as a local file path that to be run in parallel on multiple nodes. Ifsource_directoryis present, relative path should be used. Otherwise, use any path that's accessible on the machine.mini_batch_size: The size of the mini-batch passed to a singlerun()call. (optional; the default value is10files forFileDatasetand1MBforTabularDataset.)- For
FileDataset, it's the number of files with a minimum value of1. You can combine multiple files into one mini-batch. - For
TabularDataset, it's the size of data. Example values are1024,1024KB,10MB, and1GB. The recommended value is1MB. The mini-batch fromTabularDatasetwill never cross file boundaries. For example, if there are multiple .csv files with various sizes, the smallest one is 100 KB and the largest is 10 MB. Ifmini_batch_size = 1MBis set, the files smaller than 1 MB will be treated as one mini-batch and the files larger than 1 MB will be split into multiple mini-batches.Note
TabularDatasets backed by SQL can't be partitioned. TabularDatasets from a single parquet file and single row group can't be partitioned.
- For
error_threshold: The number of record failures forTabularDatasetand file failures forFileDatasetthat should be ignored during processing. Once the error count for the entire input goes above this value, the job is aborted. The error threshold is for the entire input and not for individual mini-batch sent to therun()method. The range is[-1, int.max].-1indicates ignoring all failures during processing.output_action: One of the following values indicates how the output is organized:summary_only: The user script needs to store the output files. The outputs ofrun()are used for the error threshold calculation only.append_row: For all inputs,ParallelRunStepcreates a single file in the output folder to append all outputs separated by line.
append_row_file_name: To customize the output file name for append_row output_action (optional; default value isparallel_run_step.txt).source_directory: Paths to folders that contain all files to execute on the compute target (optional).compute_target: OnlyAmlComputeis supported.node_count: The number of compute nodes to be used for running the user script.process_count_per_node: The number of worker processes per node to run the entry script in parallel. For a GPU machine, the default value is 1. For a CPU machine, the default value is the number of cores per node. A worker process callsrun()repeatedly by passing the mini batch it gets as a parameter. The total number of worker processes in your job isprocess_count_per_node * node_count, which decides the max number ofrun()to execute in parallel.environment: The Python environment definition. You can configure it to use an existing Python environment or to set up a temporary environment. The definition is also responsible for setting the required application dependencies (optional).logging_level: Log verbosity. Values in increasing verbosity are:WARNING,INFO, andDEBUG. (optional; the default value isINFO)run_invocation_timeout: Therun()method invocation timeout in seconds. (optional; default value is60)run_max_try: Maximum try count ofrun()for a mini-batch. Arun()is failed if an exception is thrown, or nothing is returned whenrun_invocation_timeoutis reached (optional; default value is3).
You can specify mini_batch_size, node_count, process_count_per_node, logging_level, run_invocation_timeout, and run_max_try as PipelineParameter, so that when you resubmit a pipeline run, you can fine-tune the parameter values.
CUDA devices visibility
For compute targets equipped with GPUs, the environment variable CUDA_VISIBLE_DEVICES is set in worker processes. In AmlCompute, you can find the total number of GPU devices in the environment variable AZ_BATCHAI_GPU_COUNT_FOUND, which is set automatically. If you would like each worker process to have a dedicated GPU, set process_count_per_node equal to the number of GPU devices on a machine. Then, each worker process gets assigned with a unique index to CUDA_VISIBLE_DEVICES. When a worker process stops for any reason, the next started worker process adopts the released GPU index.
When the total number of GPU devices is less than process_count_per_node, the worker processes with smaller index can be assigned GPU index until all GPUs have been occupied.
Given the total GPU devices is 2 and process_count_per_node = 4 as an example, process 0 and process 1 takes index 0 and 1. Process 2 and 3 does not have the environment variable. For a library using this environment variable for GPU assignment, process 2 and 3 won't have GPUs and won't try to acquire GPU devices. Process 0 releases GPU index 0 when it stops. The next process if applicable, which is process 4, will have GPU index 0 assigned.
For more information, see CUDA Pro Tip: Control GPU Visibility with CUDA_VISIBLE_DEVICES.
Parameters for creating the ParallelRunStep
Create the ParallelRunStep by using the script, environment configuration, and parameters. Specify the compute target that you already attached to your workspace as the target of execution for your inference script. Use ParallelRunStep to create the batch inference pipeline step, which takes all the following parameters:
name: The name of the step, with the following naming restrictions: unique, 3-32 characters, and regex ^[a-z]([-a-z0-9]*[a-z0-9])?$.parallel_run_config: AParallelRunConfigobject, as defined earlier.inputs: One or more single-typed Azure Machine Learning datasets to be partitioned for parallel processing.side_inputs: One or more reference data or datasets used as side inputs without need to be partitioned.output: AnOutputFileDatasetConfigobject that represents the directory path at which the output data should be stored.arguments: A list of arguments passed to the user script. Use unknown_args to retrieve them in your entry script (optional).allow_reuse: Whether the step should reuse previous results when run with the same settings/inputs. If this parameter isFalse, a new run will always be generated for this step during pipeline execution. (optional; the default value isTrue.)
from azureml.pipeline.steps import ParallelRunStep

parallelrun_step = ParallelRunStep(
    name="predict-digits-mnist",
    parallel_run_config=parallel_run_config,
    inputs=[input_mnist_ds_consumption],
    output=output_dir,
    allow_reuse=True
)
Debugging scripts from remote context
The transition from debugging a scoring script locally to debugging a scoring script in an actual pipeline can be a difficult leap. For information on finding your logs in the portal, see machine learning pipelines section on debugging scripts from a remote context. Information in that section also applies to a ParallelRunStep.
Because of the distributed nature of ParallelRunStep jobs, there are logs from several different sources. However, two consolidated files are created that provide high-level information:
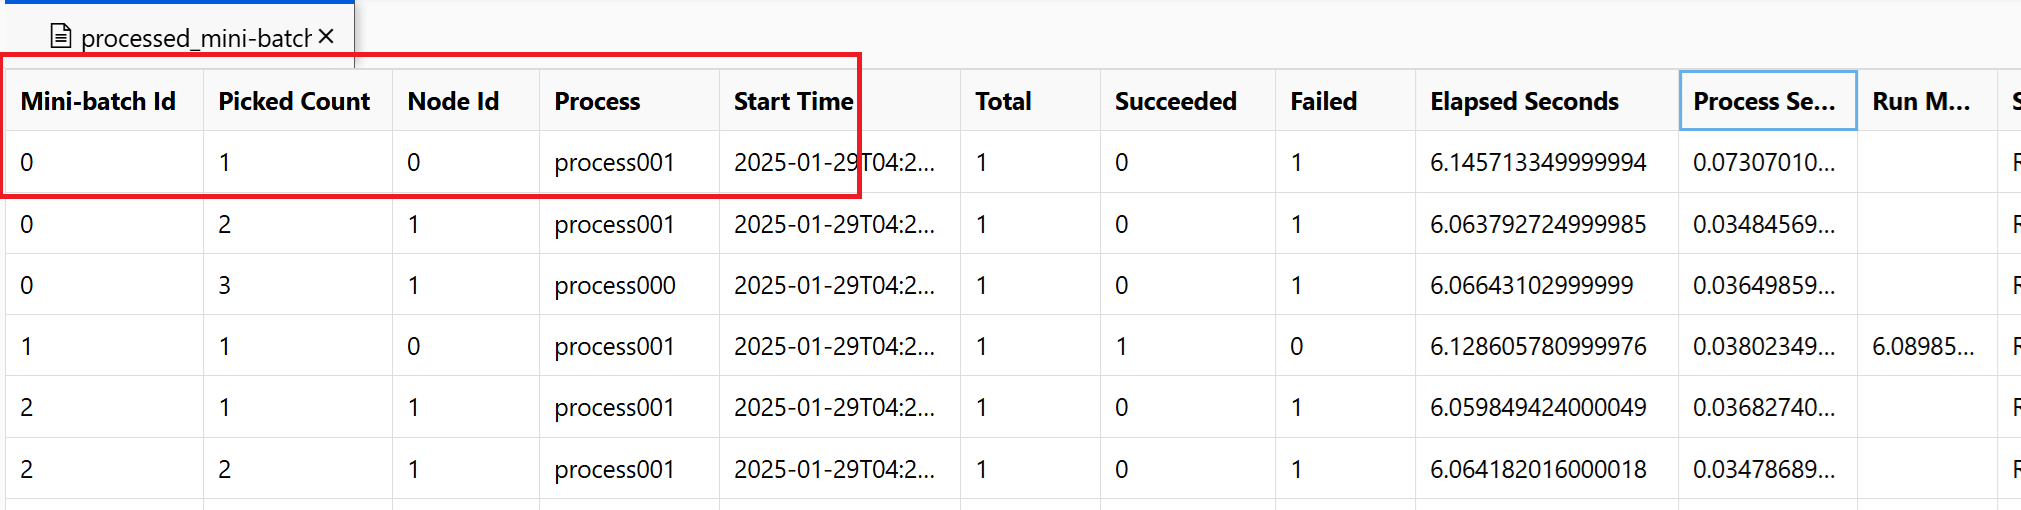
~/logs/job_progress_overview.txt: This file provides a high-level info about the number of mini-batches (also known as tasks) created so far and number of mini-batches processed so far. At this end, it shows the result of the job. If the job fails, it shows the error message and where to start the troubleshooting.~/logs/job_result.txt: It shows the result of the job. If the job failed, it shows the error message and where to start the troubleshooting.~/logs/job_error.txt: This file summarizes the errors in your script.~/logs/sys/master_role.txt: This file provides the principal node (also known as the orchestrator) view of the running job. Includes task creation, progress monitoring, the run result.~/logs/sys/job_report/processed_mini-batches.csv: A table of all minibatches that were processed. It shows result of each run of minibatch, its execution agent node id and process name. Also, the elapsed time and error messages are included. Logs for each run of minibatches can be found by following the node id and process name.
Logs generated from entry script using EntryScript helper and print statements can be found in following files:
~/logs/user/entry_script_log/<node_id>/<process_name>.log.txt: These files are the logs written from entry_script using EntryScript helper.~/logs/user/stdout/<node_id>/<process_name>.stdout.txt: These files are the logs from stdout (for example, print statement) of entry_script.~/logs/user/stderr/<node_id>/<process_name>.stderr.txt: These files are the logs from stderr of entry_script.
For example, the screenshot shows minibatch 0 failed on node 0 process001. The corresponding logs for your entry script can be found in ~/logs/user/entry_script_log/0/process001.log.txt, ~/logs/user/stdout/0/process001.log.txt and ~/logs/user/stderr/0/process001.log.txt
When you need a full understanding of how each node executed the score script, look at the individual process logs for each node. The process logs can be found in the ~/logs/sys/node folder, grouped by worker nodes:
~/logs/sys/node/<node_id>/<process_name>.txt: This file provides detailed info about each mini-batch that was picked up or completed by a worker. For each mini-batch, this file includes:- The IP address and the PID of the worker process.
- The total number of items, successfully processed items count, and failed item count.
- The start time, duration, process time and run method time.
You can also view the results of periodical checks of the resource usage for each node. The log files and setup files are in this folder:
~/logs/perf: Set--resource_monitor_intervalto change the checking interval in seconds. The default interval is600, which is approximately 10 minutes. To stop the monitoring, set the value to0. Each<node_id>folder includes:os/: Information about all running processes in the node. One check runs an operating system command and saves the result to a file. On Linux, the command isps. On Windows, usetasklist.%Y%m%d%H: The sub folder name is the time to hour.processes_%M: The file ends with the minute of the checking time.
node_disk_usage.csv: Detailed disk usage of the node.node_resource_usage.csv: Resource usage overview of the node.processes_resource_usage.csv: Resource usage overview of each process.
Common job failure reasons
SystemExit: 42
Exits 41 and 42 are PRS designed exit codes. Worker nodes exit with 41 to notify compute manager that it terminated independently. It is expected. A leader node may exit with 0 or 42 which indicates the job result. Exit 42 means the job failed. The failure reason can be found in ~/logs/job_result.txt. You can follow previous section to debug your job.
Data Permission
Error of the job indicates the compute cannot access input data. If identity-based is used for your compute cluster and storage, you can refer Identity-based data authentication.
Processes terminated unexpectedly
Processes may crash due to unexpected or unhandled exceptions, the system kills processes due to Out of Memory exceptions. In PRS system logs ~/logs/sys/node/<node-id>/_main.txt, errors like below can be found.
<process-name> exits with returncode -9.
Out of Memory
~/logs/perf logs computation resource consumption of processes. The memory usage of each task processor can be found. You can estimate the total memory usage on the node.
Out of Memory error can be found in ~/system_logs/lifecycler/<node-id>/execution-wrapper.txt.
We suggest reducing the number of processes per node or upgrade vm size if the compute resources is close the limits.
Unhandled Exceptions
In some cases, the python processes cannot catch the failing stack. You can add an environment variable env["PYTHONFAULTHANDLER"]="true" to enable python builtin fault handler.
Minibatch Timeout
You can adjust run_invocation_timeout argument according to your minibatch tasks. When you are seeing the run() functions take more time than expected, here are some tips.
Check the elapsed time and process time of the minibatch. The process time measures CPU time of the process. When process time is significantly shorter than elapsed, you can check if there are some heavy IO operations or network requests in the tasks. Long latency of those operations is the common reason of minibatch timeout.
Some specific minibatches take longer time than others. You can either update the configuration, or try work with input data to balance the minibatch processing time.
How do I log from my user script from a remote context?
ParallelRunStep may run multiple processes on one node based on process_count_per_node. In order to organize logs from each process on node and combine print and log statement, ParallelRunStep logger shown as below is recommended. You get a logger from EntryScript and make the logs show up in logs/user folder in the portal.
A sample entry script using the logger:
from azureml_user.parallel_run import EntryScript

def init():
    """Init once in a worker process."""
    entry_script = EntryScript()
    logger = entry_script.logger
    logger.info("This will show up in files under logs/user on the Azure portal.")


def run(mini_batch):
    """Call once for a mini batch. Accept and return the list back."""
    # This class is in singleton pattern. It returns the same instance as the one in init()
    entry_script = EntryScript()
    logger = entry_script.logger
    logger.info(f"{__file__}: {mini_batch}.")
    ...

    return mini_batch
Where does the message from Python logging sink to?
ParallelRunStep sets a handler on the root logger, which sinks the message to logs/user/stdout/<node_id>/processNNN.stdout.txt.
logging defaults to INFO level. By default, levels below INFO won't show up, such as DEBUG.
How could I write to a file to show up in the portal?
Files written to /logs folder will be uploaded and show up in the portal.
You can get the folder logs/user/entry_script_log/<node_id> like below and compose your file path to write:
from pathlib import Path
from azureml_user.parallel_run import EntryScript

def init():
    """Init once in a worker process."""
    entry_script = EntryScript()
    log_dir = entry_script.log_dir
    log_dir = Path(entry_script.log_dir)  # logs/user/entry_script_log/<node_id>/.
    log_dir.mkdir(parents=True, exist_ok=True) # Create the folder if not existing.

    proc_name = entry_script.agent_name  # The process name in pattern "processNNN".
    fil_path = log_dir / f"{proc_name}_<file_name>" # Avoid conflicting among worker processes with proc_name.
How to handle log in new processes?
You can spawn new processes in your entry script with subprocess module, connect to their input/output/error pipes and obtain their return codes.
The recommended approach is to use the run() function with capture_output=True. Errors show up in logs/user/error/<node_id>/<process_name>.txt.
If you would like to use Popen(), stdout/stderr should be redirect to files, like:
from pathlib import Path
from subprocess import Popen

from azureml_user.parallel_run import EntryScript


def init():
    """Show how to redirect stdout/stderr to files in logs/user/entry_script_log/<node_id>/."""
    entry_script = EntryScript()
    proc_name = entry_script.agent_name  # The process name in pattern "processNNN".
    log_dir = Path(entry_script.log_dir)  # logs/user/entry_script_log/<node_id>/.
    log_dir.mkdir(parents=True, exist_ok=True) # Create the folder if not existing.
    stdout_file = str(log_dir / f"{proc_name}_demo_stdout.txt")
    stderr_file = str(log_dir / f"{proc_name}_demo_stderr.txt")
    proc = Popen(
        ["...")],
        stdout=open(stdout_file, "w"),
        stderr=open(stderr_file, "w"),
        # ...
    )
Note
A worker process runs "system" code and the entry script code in the same process.
If no stdout or stderr specified, the setting of the worker process will be inherited by subprocesses created with Popen() in your entry script will.
stdout writes to ~/logs/sys/node/<node_id>/processNNN.stdout.txt and stderr to ~/logs/sys/node/<node_id>/processNNN.stderr.txt.
How do I write a file to the output directory, and then view it in the portal?
You can get the output directory from EntryScript class and write to it. To view the written files, in the step Run view in the Azure Machine Learning portal, select the Outputs + logs tab. Select the Data outputs link, and then complete the steps that are described in the dialog.
Use EntryScript in your entry script like in this example:
from pathlib import Path
from azureml_user.parallel_run import EntryScript

def run(mini_batch):
    output_dir = Path(entry_script.output_dir)
    (Path(output_dir) / res1).write...
    (Path(output_dir) / res2).write...
How can I pass a side input, such as a file or files containing a lookup table, to all my workers?
User can pass reference data to script using side_inputs parameter of ParalleRunStep. All datasets provided as side_inputs are mounted on each worker node. User can get the location of mount by passing argument.
Construct a Dataset containing the reference data, specify a local mount path and register it with your workspace. Pass it to the side_inputs parameter of your ParallelRunStep. Additionally, you can add its path in the arguments section to easily access its mounted path.
Note
Use FileDatasets only for side_inputs.
local_path = "/tmp/{}".format(str(uuid.uuid4()))
label_config = label_ds.as_named_input("labels_input").as_mount(local_path)
batch_score_step = ParallelRunStep(
    name=parallel_step_name,
    inputs=[input_images.as_named_input("input_images")],
    output=output_dir,
    arguments=["--labels_dir", label_config],
    side_inputs=[label_config],
    parallel_run_config=parallel_run_config,
)
After that you can access it in your script (for example, in your init() method) as follows:
parser = argparse.ArgumentParser()
parser.add_argument('--labels_dir', dest="labels_dir", required=True)
args, _ = parser.parse_known_args()

labels_path = args.labels_dir
How to use input datasets with service principal authentication?
User can pass input datasets with service principal authentication used in workspace. Using such dataset in ParallelRunStep requires that dataset to be registered for it to construct ParallelRunStep configuration.
service_principal = ServicePrincipalAuthentication(
    tenant_id="***",
    service_principal_id="***",
    service_principal_password="***")

ws = Workspace(
    subscription_id="***",
    resource_group="***",
    workspace_name="***",
    auth=service_principal
    )

default_blob_store = ws.get_default_datastore() # or Datastore(ws, '***datastore-name***')
ds = Dataset.File.from_files(default_blob_store, '**path***')
registered_ds = ds.register(ws, '***dataset-name***', create_new_version=True)
How to Check Progress and Analyze it
This section is about how to check the progress of a ParallelRunStep job and check the cause of unexpected behavior.
How to check job progress?
Besides looking at the overall status of the StepRun, the count of scheduled/processed mini-batches and the progress of generating output can be viewed in ~/logs/job_progress_overview.<timestamp>.txt. The file rotates on daily basis. You can check the one with the largest timestamp for the latest information.
What should I check if there is no progress for a while?
You can go into ~/logs/sys/error to see if there's any exception. If there is none, it is likely that your entry script is taking a long time, you can print progress information in your code to locate the time-consuming part, or add "--profiling_module", "cProfile" to the arguments of ParallelRunStep to generate a profile file named as <process_name>.profile under ~/logs/sys/node/<node_id> folder.
When will a job stop?
If not canceled, the job may stop with status:
- Completed. All mini-batches are processed successfully and output is generated for
append_rowmode. - Failed. If
error_thresholdinParameters for ParallelRunConfigis exceeded, or system error occurs during the job.
Where to find the root cause of failure?
You can follow the lead in ~/logs/job_result.txt to find the cause and detailed error log.
Will node failure impact the job result?
Not if there are other available nodes in the designated compute cluster. ParallelRunStep can run independently on each node. Single node failure doesn't fail the whole job.
What happens if init function in entry script fails?
ParallelRunStep has mechanism to retry for a certain time to give chance for recovery from transient issues without delaying the job failure for too long. The mechanism is as follows:
- If after a node starts,
initon all agents keeps failing, we will stop trying after3 * process_count_per_nodefailures. - If after job starts,
initon all agents of all nodes keeps failing, we will stop trying if job runs more than 2 minutes and there're2 * node_count * process_count_per_nodefailures. - If all agents are stuck on
initfor more than3 * run_invocation_timeout + 30seconds, the job would fail because of no progress for too long.
What happens on OutOfMemory? How can I check the cause?
The process may be terminated by system. ParallelRunStep sets the current attempt to process the mini-batch to failure status and try to restart the failed process. You can check ~logs/perf/<node_id> to find the memory-consuming process.
Why do I have many processNNN files?
ParallelRunStep starts new worker processes in replace of the ones exited abnormally. And each process generates a set of processNNN files as log. However, if the process failed because of exception during the init function of user script, and that the error repeated continuously for 3 * process_count_per_node times, no new worker process will be started.
Next steps
See these Jupyter notebooks demonstrating Azure Machine Learning pipelines
See the SDK reference for help with the azureml-pipeline-steps package.
View reference documentation for ParallelRunConfig class and documentation for ParallelRunStep class.
Follow the advanced tutorial on using pipelines with ParallelRunStep. The tutorial shows how to pass another file as a side input.