Microsoft Defender for Cloud troubleshooting guide
This guide is for IT professionals, information security analysts, and cloud administrators whose organizations need to troubleshoot problems related to Microsoft Defender for Cloud.
Tip
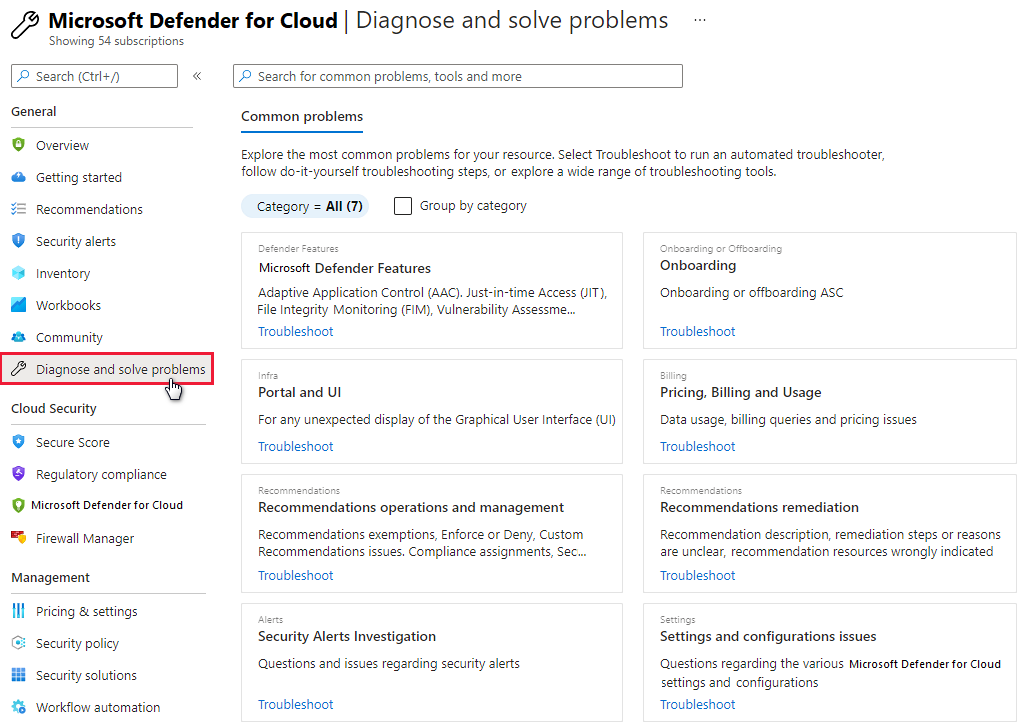
When you're facing a problem or need advice from our support team, the Diagnose and solve problems section of the Azure portal is a good place to look for solutions.
Use the audit log to investigate problems
The first place to look for troubleshooting information is the audit log for the failed component. In the audit log, you can see details like:
- Which operations were performed.
- Who initiated the operation.
- When the operation occurred.
- The status of the operation.
The audit log contains all write operations (PUT, POST, DELETE) performed on your resources, but not read operations (GET).
Troubleshoot connectors
Defender for Cloud uses connectors to collect monitoring data from Amazon Web Services (AWS) accounts and Google Cloud Platform (GCP) projects. If you're experiencing problems with the connectors or you don't see data from AWS or GCP, review the following troubleshooting tips.
Tips for common connector problems
- Make sure that the subscription associated with the connector is selected in the subscription filter located in the Directories + subscriptions section of the Azure portal.
- Standards should be assigned on the security connector. To check, go to Environment settings on the Defender for Cloud left menu, select the connector, and then select Settings. If no standards are assigned, select the three dots to check if you have permissions to assign standards.
- A connector resource should be present in Azure Resource Graph. Use the following Resource Graph query to check:
resources | where ['type'] =~ "microsoft.security/securityconnectors". - Make sure that sending Kubernetes audit logs is enabled on the AWS or GCP connector so that you can get threat detection alerts for the control plane.
- Make sure that the Microsoft Defender sensor and the Azure Policy for Azure Arc-enabled Kubernetes extensions were installed successfully to your Amazon Elastic Kubernetes Service (EKS) and Google Kubernetes Engine (GKE) clusters. You can verify and install the agent with the following Defender for Cloud recommendations:
- EKS clusters should have Microsoft Defender's extension for Azure Arc installed
- GKE clusters should have Microsoft Defender's extension for Azure Arc installed
- Azure Arc-enabled Kubernetes clusters should have the Azure Policy extension installed
- GKE clusters should have the Azure Policy extension installed
- If you're experiencing problems with deleting the AWS or GCP connector, check if you have a lock. An error in the Azure activity log might hint at the presence of a lock.
- Check that workloads exist in the AWS account or GCP project.
Tips for AWS connector problems
- Make sure that the CloudFormation template deployment finished successfully.
- Wait at least 12 hours after creation of the AWS root account.
- Make sure that EKS clusters are successfully connected to Azure Arc-enabled Kubernetes.
- If you don't see AWS data in Defender for Cloud, make sure that the required AWS resources for sending data to Defender for Cloud exist in the AWS account.
Cost impact of API calls to AWS
When you onboard your AWS single or management account, the discovery service in Defender for Cloud starts an immediate scan of your environment. The discovery service executes API calls to various service endpoints in order to retrieve all resources that Azure helps secure.
After this initial scan, the service continues to periodically scan your environment at the interval that you configured during onboarding. In AWS, each API call to the account generates a lookup event that's recorded in the CloudTrail resource. The CloudTrail resource incurs costs. For pricing details, see the AWS CloudTrail Pricing page on the Amazon AWS site.
If you connected your CloudTrail to GuardDuty, you're also responsible for associated costs. You can find these costs in the GuardDuty documentation on the Amazon AWS site.
Get the number of native API calls
There are two ways to get the number of calls that Defender for Cloud made:
- Use an existing Athena table or create a new one. For more information, see Querying AWS CloudTrail logs on the Amazon AWS site.
- Use an existing event data store or create a new one. For more information, see Working with AWS CloudTrail Lake on the Amazon AWS site.
Both methods rely on querying AWS CloudTrail logs.
To get the number of calls, go to the Athena table or the event data store and use one of the following predefined queries, according to your needs. Replace <TABLE-NAME> with the ID of the Athena table or event data store.
List the number of overall API calls by Defender for Cloud:
SELECT COUNT(*) AS overallApiCallsCount FROM <TABLE-NAME>
WHERE userIdentity.arn LIKE 'arn:aws:sts::<YOUR-ACCOUNT-ID>:assumed-role/CspmMonitorAws/MicrosoftDefenderForClouds_<YOUR-AZURE-TENANT-ID>'
AND eventTime > TIMESTAMP '<DATETIME>'
List the number of overall API calls by Defender for Cloud aggregated by day:
SELECT DATE(eventTime) AS apiCallsDate, COUNT(*) AS apiCallsCountByRegion FROM <TABLE-NAME>
WHERE userIdentity.arn LIKE 'arn:aws:sts:: <YOUR-ACCOUNT-ID>:assumed-role/CspmMonitorAws/MicrosoftDefenderForClouds_<YOUR-AZURE-TENANT-ID>'
AND eventTime > TIMESTAMP '<DATETIME>' GROUP BY DATE(eventTime)
List the number of overall API calls by Defender for Cloud aggregated by event name:
SELECT eventName, COUNT(*) AS apiCallsCountByEventName FROM <TABLE-NAME>
WHERE userIdentity.arn LIKE 'arn:aws:sts::<YOUR-ACCOUNT-ID>:assumed-role/CspmMonitorAws/MicrosoftDefenderForClouds_<YOUR-AZURE-TENANT-ID>'
AND eventTime > TIMESTAMP '<DATETIME>' GROUP BY eventName
List the number of overall API calls by Defender for Cloud aggregated by region:
SELECT awsRegion, COUNT(*) AS apiCallsCountByRegion FROM <TABLE-NAME>
WHERE userIdentity.arn LIKE 'arn:aws:sts::120589537074:assumed-role/CspmMonitorAws/MicrosoftDefenderForClouds_<YOUR-AZURE-TENANT-ID>'
AND eventTime > TIMESTAMP '<DATETIME>' GROUP BY awsRegion
Tips for GCP connector problems
- Make sure that the GCP Cloud Shell script finished successfully.
- Make sure that GKE clusters are successfully connected to Azure Arc-enabled Kubernetes.
- Make sure that Azure Arc endpoints are in the firewall allowlist. The GCP connector makes API calls to these endpoints to fetch the necessary onboarding files.
- If the onboarding of GCP projects fails, make sure you have
compute.regions.listpermission and Microsoft Entra permission to create the service principal for the onboarding process. Make sure that the GCP resourcesWorkloadIdentityPoolId,WorkloadIdentityProviderId, andServiceAccountEmailare created in the GCP project.
Defender API calls to GCP
When you onboard your GCP single project or organization, the discovery service in Defender for Cloud starts an immediate scan of your environment. The discovery service executes API calls to various service endpoints in order to retrieve all resources that Azure helps secure.
After this initial scan, the service continues to periodically scan your environment at the interval that you configured during onboarding.
To get the number of native API calls that Defender for Cloud executed:
Go to Logging > Log Explorer.
Filter the dates as you want (for example, 1d).
To show API calls that Defender for Cloud executed, run this query:
protoPayload.authenticationInfo.principalEmail : "microsoft-defender"
Refer to the histogram to see the number of calls over time.
Troubleshoot the Log Analytics agent
Defender for Cloud uses the Log Analytics agent to collect and store data. The information in this article represents Defender for Cloud functionality after transition to the Log Analytics agent.
The alert types are:
- Virtual Machine Behavioral Analysis (VMBA)
- Network analysis
- Azure SQL Database and Azure Synapse Analytics analysis
- Contextual information
Depending on the alert type, you can gather the necessary information to investigate an alert by using the following resources:
- Security logs in the virtual machine (VM) event viewer in Windows
- The audit daemon (
auditd) in Linux - The Azure activity logs and the enabled diagnostic logs on the attack resource
You can share feedback for the alert description and relevance. Go to the alert, select the Was This Useful button, select the reason, and then enter a comment to explain the feedback. We consistently monitor this feedback channel to improve our alerts.
Check the Log Analytics agent processes and versions
Just like Azure Monitor, Defender for Cloud uses the Log Analytics agent to collect security data from your Azure virtual machines. After you enable data collection and correctly install the agent in the target machine, the HealthService.exe process should be running.
Open the services management console (services.msc) to make sure that the Log Analytics agent service is running.
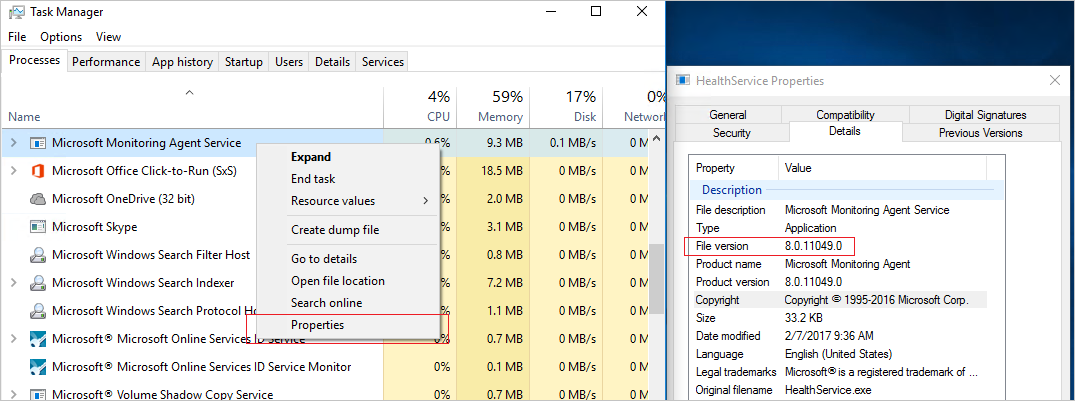
To see which version of the agent you have, open Task Manager. On the Processes tab, locate the Log Analytics agent service, right-click it, and then select Properties. On the Details tab, look for the file version.
Check installation scenarios for the Log Analytics agent
There are two installation scenarios that can produce different results when you're installing the Log Analytics agent on your computer. The supported scenarios are:
Agent installed automatically by Defender for Cloud: You can view the alerts in Defender for Cloud and log search. You receive email notifications at the email address that you configured in the security policy for the subscription that the resource belongs to.
Agent manually installed on a VM located in Azure: In this scenario, if you're using agents downloaded and installed manually before February 2017, you can view the alerts in the Defender for Cloud portal only if you filter on the subscription that the workspace belongs to. If you filter on the subscription that the resource belongs to, you won't see any alerts. You receive email notifications at the email address that you configured in the security policy for the subscription that the workspace belongs to.
To avoid the filtering problem, be sure to download the latest version of the agent.
Monitor network connectivity problems for the agent
For agents to connect to and register with Defender for Cloud, they must have access to the DNS addresses and network ports for Azure network resources. To enable this access, take these actions:
- When you use proxy servers, make sure that the appropriate proxy server resources are configured correctly in the agent settings.
- Configure your network firewalls to permit access to Log Analytics.
The Azure network resources are:
| Agent resource | Port | Bypass HTTPS inspection |
|---|---|---|
*.ods.opinsights.azure.com |
443 | Yes |
*.oms.opinsights.azure.com |
443 | Yes |
*.blob.core.windows.net |
443 | Yes |
*.azure-automation.net |
443 | Yes |
If you're having trouble onboarding the Log Analytics agent, read Troubleshoot Operations Management Suite onboarding issues.
Troubleshoot improperly working antimalware protection
The guest agent is the parent process of everything that the Microsoft Antimalware extension does. When the guest agent process fails, the Microsoft Antimalware protection that runs as a child process of the guest agent might also fail.
Here are some troubleshooting tips:
- If the target VM was created from a custom image, make sure that the creator of the VM installed a guest agent.
- If the target is a Linux VM, installing the Windows version of the antimalware extension will fail. The Linux guest agent has specific OS and package requirements.
- If the VM was created with an old version of the guest agent, the old agent might not have the ability to automatically update to the newer version. Always use the latest version of the guest agent when you create your own images.
- Some third-party administration software might disable the guest agent or block access to certain file locations. If third-party administration software is installed on your VM, make sure that the antimalware agent is on the exclusion list.
- Make sure that firewall settings and a network security group aren't blocking network traffic to and from the guest agent.
- Make sure that no access control lists are preventing disk access.
- The guest agent needs sufficient disk space to function properly.
By default, the Microsoft Antimalware user interface is disabled. But you can enable the Microsoft Antimalware user interface on Azure Resource Manager VMs.
Troubleshoot problems with loading the dashboard
If you experience problems with loading the workload protection dashboard, make sure that the user who first enabled Defender for Cloud on the subscription and the user who wants to turn on data collection have the Owner or Contributor role on the subscription. If so, users with the Reader role on the subscription can see the dashboard, alerts, recommendations, and policy.
Troubleshoot connector problems for the Azure DevOps organization
If you can't onboard your Azure DevOps organization, try the following troubleshooting tips:
Make sure you're using a non-preview version of the Azure portal; the authorize step doesn't work in the Azure preview portal.
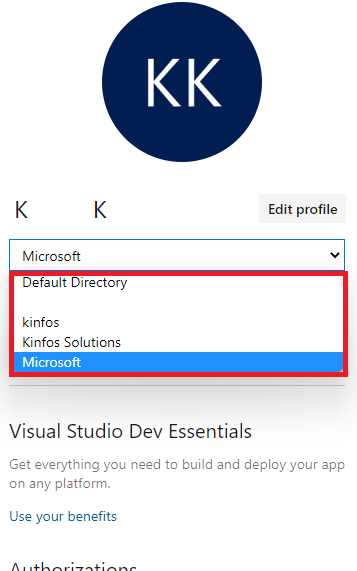
It's important to know which account you're signed in to when you authorize the access, because that will be the account that the system uses for onboarding. Your account can be associated with the same email address but also associated with different tenants. Make sure that you select the right account/tenant combination. If you need to change the combination:
On your Azure DevOps profile page, use the dropdown menu to select another account.
After you select the correct account/tenant combination, go to Environment settings in Defender for Cloud and edit your Azure DevOps connector. Reauthorize the connector to update it with the correct account/tenant combination. You should then see the correct list of organizations on the dropdown menu.
Ensure that you have the Project Collection Administrator role on the Azure DevOps organization that you want to onboard.
Ensure that the Third-party application access via OAuth toggle is On for the Azure DevOps organization. Learn more about enabling OAuth access.
Contact Microsoft support
You can also find troubleshooting information for Defender for Cloud at the Defender for Cloud Q&A page.
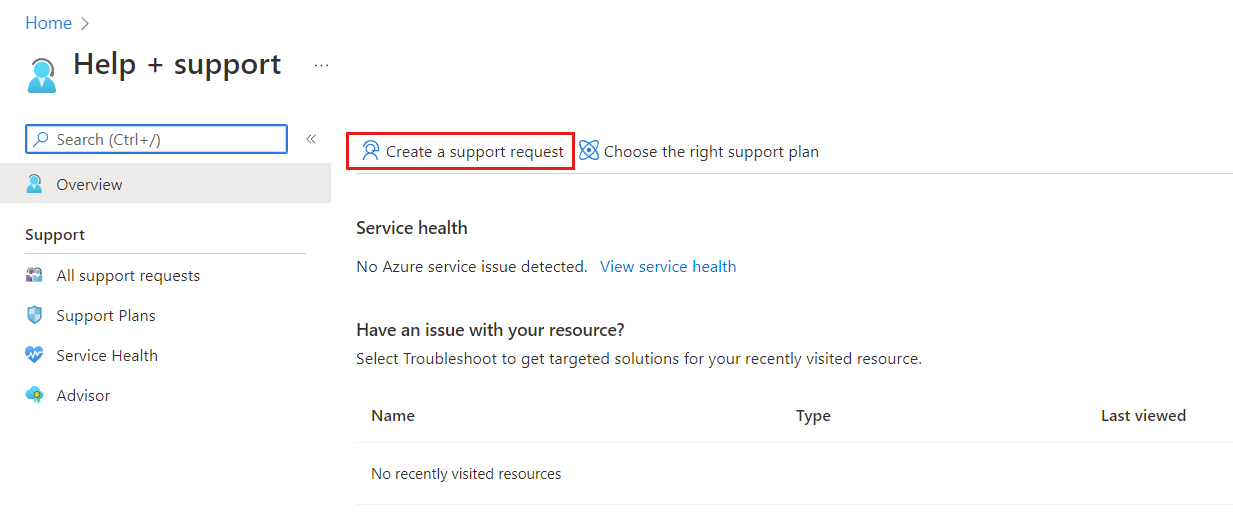
If you need more assistance, you can open a new support request on the Azure portal. On the Help + support page, select Create a support request.
See also
- Learn how to manage and respond to security alerts in Defender for Cloud.
- Learn about alert validation in Defender for Cloud.
- Review common questions about using Defender for Cloud.


