Azure Monitor Logs
Azure Backup provides built-in monitoring and alerting capabilities in a Recovery Services vault. These capabilities are available without any additional management infrastructure. The only pre-requisite for this capability is to have Log Analytics workspace configured. This feature is supported in the following scenarios:
- Monitoring data from multiple Recovery Services vaults across Subscriptions
- Visibility into custom scenarios
- Configuring alerts for custom scenarios
- Viewing information from an on-premises component. For example, System Center Data Protection Manager information in Azure, which the portal doesn't show in Backup Jobs or Backup Alerts
Using Log Analytics workspace
Prerequisites for using Log Analytics workspace
Before you use Log Analytics for monitoring, consider the following prerequisites:
- Ensure that you have a Log Analytics workspace set up. If not available, create one.
- Configure Diagnostic Settings to push data to Log Analytics.
- Configure the retention of the tables or the Log Analytics workspace based on the desired historical retention.
Create alerts by using Log Analytics
In Azure Monitor, you can create your own alerts in a Log Analytics workspace. In the workspace, you use Azure action groups to select your preferred notification mechanism.
Important
For information on the cost of creating this query, see Azure Monitor pricing.
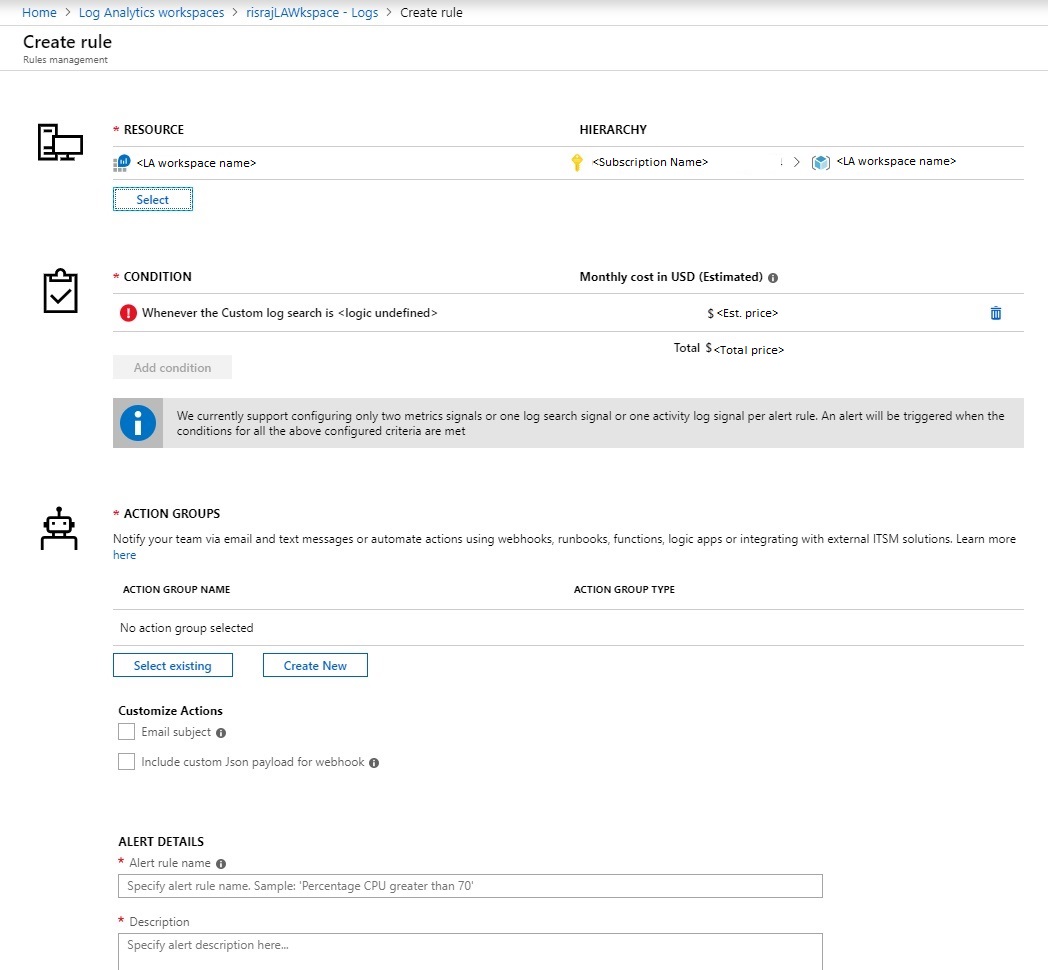
Open the Logs section of the Log Analytics workspace and create a query for your own Logs. When you select New Alert Rule, the Azure Monitor alert-creation page opens, as shown in the following image.

Here the resource is already marked as the Log Analytics workspace, and action group integration is provided.

Alert condition
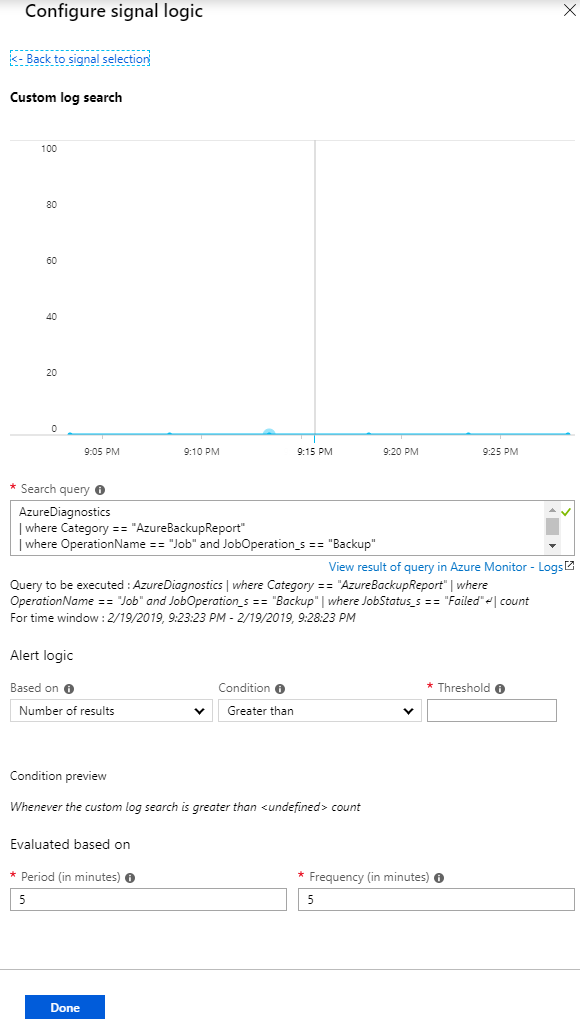
The defining characteristic of an alert is its triggering condition. Select Condition to automatically load the Kusto query on the Logs page as shown in the following image. Here you can edit the condition to suit your needs. For more information, see Sample Kusto queries.

If necessary, you can edit the Kusto query. Choose a threshold, period, and frequency. The threshold determines when the alert will be raised. The period is the window of time in which the query is run. For example, if the threshold is greater than 0, the period is 5 minutes, and the frequency is 5 minutes, then the rule runs the query every 5 minutes, reviewing the previous 5 minutes. If the number of results is greater than 0, you're notified through the selected action group.
Note
To run the alert rule once a day, across all the events/logs that were created on the given day, change the value of both 'period' and 'frequency' to 1440, that is, 24 hours.
Alert action groups
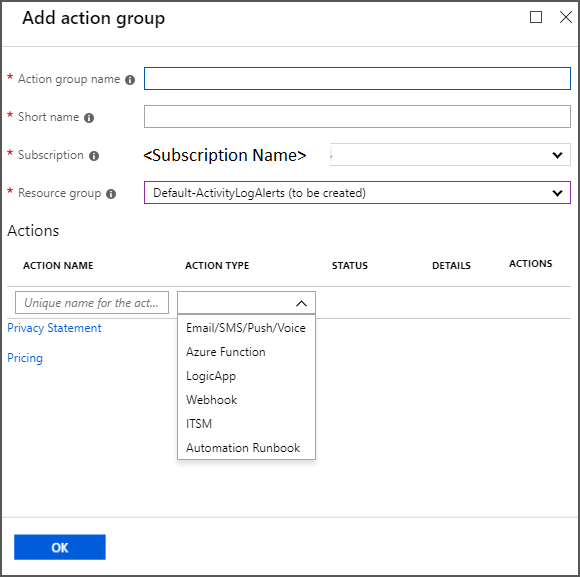
Use an action group to specify a notification channel. To see the available notification mechanisms, under Action groups, select Create New.

You can satisfy all alerting and monitoring requirements from Log Analytics alone, or you can use Log Analytics to supplement built-in notifications.
For more information, see Create, view, and manage log alerts by using Azure Monitor and Create and manage action groups in the Azure portal.
Sample Kusto queries
The default graphs give you Kusto queries for basic scenarios on which you can build alerts. You can also modify the queries to fetch the data you want to be alerted on. Paste the following sample Kusto queries on the Logs page, and then create alerts on the queries.
Recovery Services vaults and Backup vaults send data to a common set of tables that are listed in this article. However, there are slight differences in the schema for Recovery Services vaults and Backup vaults (learn more). So, this section is split into multiple sub-sections that helps you to use the right queries depending on which workload or vault types you want to query.
Queries common across Recovery Services vaults and Backup vaults
All successful backup jobs
AddonAzureBackupJobs
| where JobOperation=="Backup"
| summarize arg_max(TimeGenerated,*) by JobUniqueId
| where JobStatus=="Completed"
All failed backup jobs
AddonAzureBackupJobs
| where JobOperation=="Backup"
| summarize arg_max(TimeGenerated,*) by JobUniqueId
| where JobStatus=="Failed"
Queries specific to Recovery Services vault workloads
All successful Azure VM backup jobs
AddonAzureBackupJobs
| where JobOperation=="Backup"
| summarize arg_max(TimeGenerated,*) by JobUniqueId
| where JobStatus=="Completed"
| join kind=inner
(
    CoreAzureBackup
    | where OperationName == "BackupItem"
    | where BackupItemType=="VM" and BackupManagementType=="IaaSVM"
    | distinct BackupItemUniqueId, BackupItemFriendlyName
)
on BackupItemUniqueId
All successful SQL log backup jobs
AddonAzureBackupJobs
| where JobOperation=="Backup" and JobOperationSubType=="Log"
| summarize arg_max(TimeGenerated,*) by JobUniqueId
| where JobStatus=="Completed"
| join kind=inner
(
    CoreAzureBackup
    | where OperationName == "BackupItem"
    | where BackupItemType=="SQLDataBase" and BackupManagementType=="AzureWorkload"
    | distinct BackupItemUniqueId, BackupItemFriendlyName
)
on BackupItemUniqueId
All successful Azure Backup agent jobs
AddonAzureBackupJobs
| where JobOperation=="Backup"
| summarize arg_max(TimeGenerated,*) by JobUniqueId
| where JobStatus=="Completed"
| join kind=inner
(
    CoreAzureBackup
    | where OperationName == "BackupItem"
    | where BackupItemType=="FileFolder" and BackupManagementType=="MAB"
    | distinct BackupItemUniqueId, BackupItemFriendlyName
)
on BackupItemUniqueId
Backup Storage Consumed per Backup Item
CoreAzureBackup
//Get all Backup Items
| where OperationName == "BackupItem"
//Get distinct Backup Items
| distinct BackupItemUniqueId, BackupItemFriendlyName
| join kind=leftouter
(AddonAzureBackupStorage
| where OperationName == "StorageAssociation"
//Get latest record for each Backup Item
| summarize arg_max(TimeGenerated, *) by BackupItemUniqueId
| project BackupItemUniqueId , StorageConsumedInMBs)
on BackupItemUniqueId
| project BackupItemUniqueId , BackupItemFriendlyName , StorageConsumedInMBs
| sort by StorageConsumedInMBs desc
Queries specific to Backup vault workloads
All successful Azure PostgreSQL backup jobs
AddonAzureBackupJobs
| where JobOperation=="Backup"
| summarize arg_max(TimeGenerated,*) by JobUniqueId
  | where DatasourceType == "Microsoft.DBforPostgreSQL/servers/databases"
| where JobStatus=="Completed"
All successful Azure Disk restore jobs
AddonAzureBackupJobs
| where JobOperation == "Restore"
| summarize arg_max(TimeGenerated,*) by JobUniqueId
| where DatasourceType == "Microsoft.Compute/disks"
| where JobStatus=="Completed"
Backup Storage Consumed per Backup Item
CoreAzureBackup
| where OperationName == "BackupItem"
| summarize arg_max(TimeGenerated, *) by BackupItemUniqueId
| project BackupItemUniqueId, BackupItemFriendlyName, StorageConsumedInMBs
Diagnostic data update frequency
The diagnostic data from the vault is pumped to the Log Analytics workspace with some lag. Every event arrives at the Log Analytics workspace 20 to 30 minutes after it's pushed from the Recovery Services vault. Here are further details about the lag:
- Across all solutions, the backup service's built-in alerts are pushed as soon as they're created. So they usually appear in the Log Analytics workspace after 20 to 30 minutes.
- Across all solutions, on-demand backup jobs and restore jobs are pushed as soon as they finish.
- For all solutions except SQL and SAP HANA backup, scheduled backup jobs are pushed as soon as they finish.
- For SQL and SAP HANA backup, because log backups can occur every 15 minutes, information for all the completed scheduled backup jobs, including logs, is batched and pushed every 6 hours.
- Across all solutions, other information such as the backup item, policy, recovery points, storage, and so on, is pushed at least once per day.
- A change in the backup configuration (such as changing policy or editing policy) triggers a push of all related backup information.
Note
The same delay applies to other destinations for diagnostics data, such as Storage accounts and Event Hubs.
Using the Recovery Services vault's activity logs
Caution
The following steps apply only to Azure VM backups. You can't use these steps for solutions such as the Azure Backup agent, SQL backups within Azure, or Azure Files.
You can also use activity logs to get notification for events such as backup success. To begin, follow these steps:
- Sign in into the Azure portal.
- Open the relevant Recovery Services vault.
- In the vault's properties, open the Activity log section.
To identify the appropriate log and create an alert:
Verify that you're receiving activity logs for successful backups by applying the filters shown in the following image. Change the Timespan value as necessary to view records.

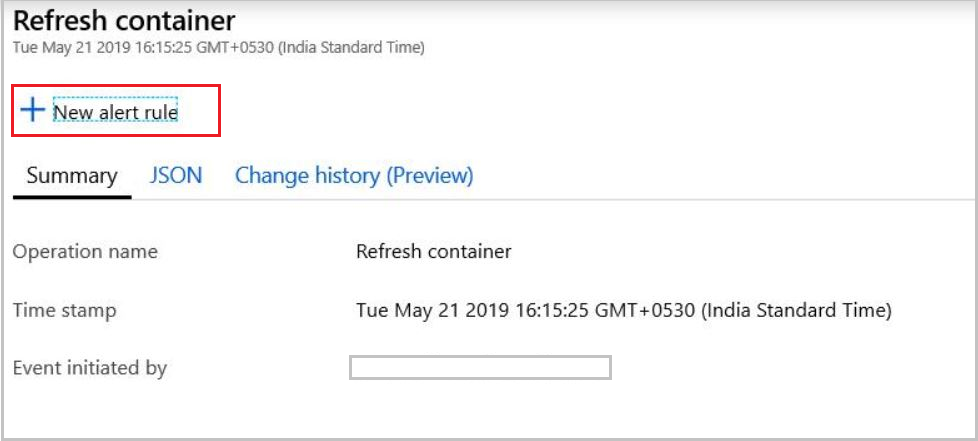
Select the operation name to see the relevant details.
Select New alert rule to open the Create rule page.
Create an alert by following the steps in Create, view, and manage activity log alerts by using Azure Monitor.

Here the resource is the Recovery Services vault itself. Repeat the same steps for all of the vaults in which you want to be notified through activity logs. The condition won't have a threshold, period, or frequency because this alert is based on events. As soon as the relevant activity log is generated, the alert is raised.
Using Log Analytics to monitor at scale
You can view all alerts created from activity logs and Log Analytics workspaces in Azure Monitor. Just open the Alerts pane on the left.
Although you can get notifications through activity logs, we highly recommend using Log Analytics rather than activity logs for monitoring at scale. Here's why:
- Limited scenarios: Notifications through activity logs apply only to Azure VM backups. The notifications must be set up for every Recovery Services vault.
- Definition fit: The scheduled backup activity doesn't fit with the latest definition of activity logs. Instead, it aligns with resource logs. This alignment causes unexpected effects when the data that flows through the activity log channel changes.
- Problems with the activity log channel: In Recovery Services vaults, activity logs that are pumped from Azure Backup follow a new model. Unfortunately, this change affects the generation of activity logs in Azure Government, Azure Germany, and Microsoft Azure operated by 21Vianet. If users of these cloud services create or configure any alerts from activity logs in Azure Monitor, the alerts aren't triggered. Also, in all Azure public regions, if a user collects Recovery Services activity logs into a Log Analytics workspace, these logs don't appear.
Use a Log Analytics workspace for monitoring and alerting at scale for all your workloads that are protected by Azure Backup.
Next steps
To create custom queries, see Log Analytics data model.