Intelligent Insights to monitor and troubleshoot database performance (preview)
Applies to:
Azure SQL Database
Azure SQL Managed Instance
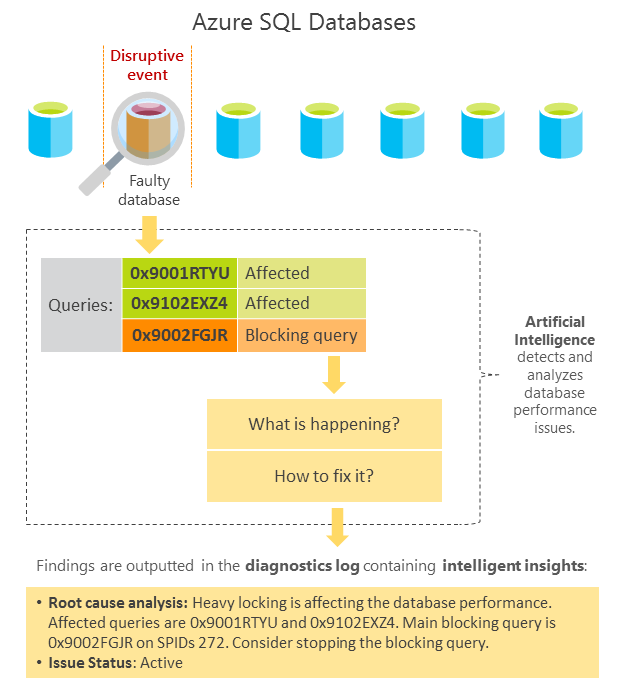
Intelligent Insights in Azure SQL Database and Azure SQL Managed Instance lets you know what is happening with your database performance.
Intelligent Insights uses built-in intelligence to continuously monitor database usage through artificial intelligence and detect disruptive events that cause poor performance. Once detected, a detailed analysis is performed that generates an Intelligent Insights resource log called SQLInsights (unrelated to Azure Monitor SQL Insights (preview)) with an intelligent assessment of the issues. This assessment consists of a root cause analysis of the database performance issue and, where possible, recommendations for performance improvements.
What can Intelligent Insights do for you?
Intelligent Insights is a unique capability of Azure built-in intelligence that provides the following value:
- Proactive monitoring
- Tailored performance insights
- Early detection of database performance degradation
- Root cause analysis of issues detected
- Performance improvement recommendations
- Scale out capability on hundreds of thousands of databases
- Positive impact to DevOps resources and the total cost of ownership
How does Intelligent Insights work
Intelligent Insights analyzes database performance by comparing the database workload from the last hour with the past seven-day baseline workload. Database workload is composed of queries determined to be the most significant to the database performance, such as the most repeated and largest queries. Because each database is unique based on its structure, data, usage, and application, each workload baseline that is generated is specific and unique to that workload. Intelligent Insights, independent of the workload baseline, also monitors absolute operational thresholds and detects issues with excessive wait times, critical exceptions, and issues with query parameterizations that might affect performance.
After a performance degradation issue is detected from multiple observed metrics by using artificial intelligence, analysis is performed. A diagnostics log is generated with an intelligent insight on what is happening with your database. Intelligent Insights makes it easy to track the database performance issue from its first appearance until resolution. Each detected issue is tracked through its lifecycle from initial issue detection and verification of performance improvement to its completion.

The metrics used to measure and detect database performance issues are based on query duration, timeout requests, excessive wait times, and errored requests. For more information on metrics, see Detection metrics.
Identified database performance degradations are recorded in the Intelligent Insights SQLInsights log with intelligent entries that consist of the following properties:
| Property | Details |
|---|---|
| Database information | Metadata about a database on which an insight was detected, such as a resource URI. |
| Observed time range | Start and end time for the period of the detected insight. |
| Impacted metrics | Metrics that caused an insight to be generated:
|
| Impact value | Value of a metric measured. |
| Impacted queries and error codes | Query hash or error code. These can be used to easily correlate to affected queries. Metrics that consist of either query duration increase, waiting time, timeout counts, or error codes are provided. |
| Detections | Detection identified at the database during the time of an event. There are 15 detection patterns. For more information, see Troubleshoot database performance issues with Intelligent Insights. |
| Root cause analysis | Root cause analysis of the issue identified in a human-readable format. Some insights might contain a performance improvement recommendation where possible. |
Intelligent Insights shines in discovering and troubleshooting database performance issues. In order to use Intelligent Insights to troubleshoot database performance issues, see Troubleshoot performance issues with Intelligent Insights.
Intelligent Insights options
Intelligent Insights options available are:
| Intelligent Insights option | Azure SQL Database support | Azure SQL Managed Instance support |
|---|---|---|
| Configure Intelligent Insights - Configure Intelligent Insights analysis for your databases. | Yes | Yes |
| Stream insights to Azure SQL Analytics -- Stream insights to Azure SQL Analytics. | Yes | Yes |
| Stream insights to Azure Event Hubs - Stream insights to Event Hubs for further custom integrations. | Yes | Yes |
| Stream insights to Azure Storage - Stream insights to Azure Storage for further analysis and long-term archival. | Yes | Yes |
Note
Intelligent insights is a preview feature, not available in the following regions: West Europe, North Europe, West US 1 and East US 1.
Configure the export of the Intelligent Insights log
Output of the Intelligent Insights can be streamed to one of several destinations for analysis:
- Output streamed to a Log Analytics workspace can be used with Azure SQL Analytics to view insights through the user interface of the Azure portal. This is the integrated Azure solution, and the most typical way to view insights.
- Output streamed to Azure Event Hubs can be used for development of custom monitoring and alerting scenarios
- Output streamed to Azure Storage can be used for custom application development for custom reporting, long-term data archival, and so forth.
Integration of Azure SQL Analytics, Azure Event Hubs, Azure Storage, or third-party products for consumption is performed through first enabling Intelligent Insights logging (the "SQLInsights" log) in the Diagnostic settings page of a database, and then configuring Intelligent Insights log data to be streamed into one of these destinations.
For more information on how to enable Intelligent Insights logging and to configure metric and resource log data to be streamed to a consuming product, see Metrics and diagnostics logging.
Set up with Azure SQL Analytics
Azure SQL Analytics solution provides graphical user interface, reporting and alerting capabilities on database performance, using the Intelligent Insights resource log data.
Add Azure SQL Analytics to your Azure portal dashboard from the marketplace and to create a workspace, see configure Azure SQL Analytics
To use Intelligent Insights with Azure SQL Analytics, configure Intelligent Insights log data to be streamed to Azure SQL Analytics workspace you've created in the previous step, see Metrics and diagnostics logging.
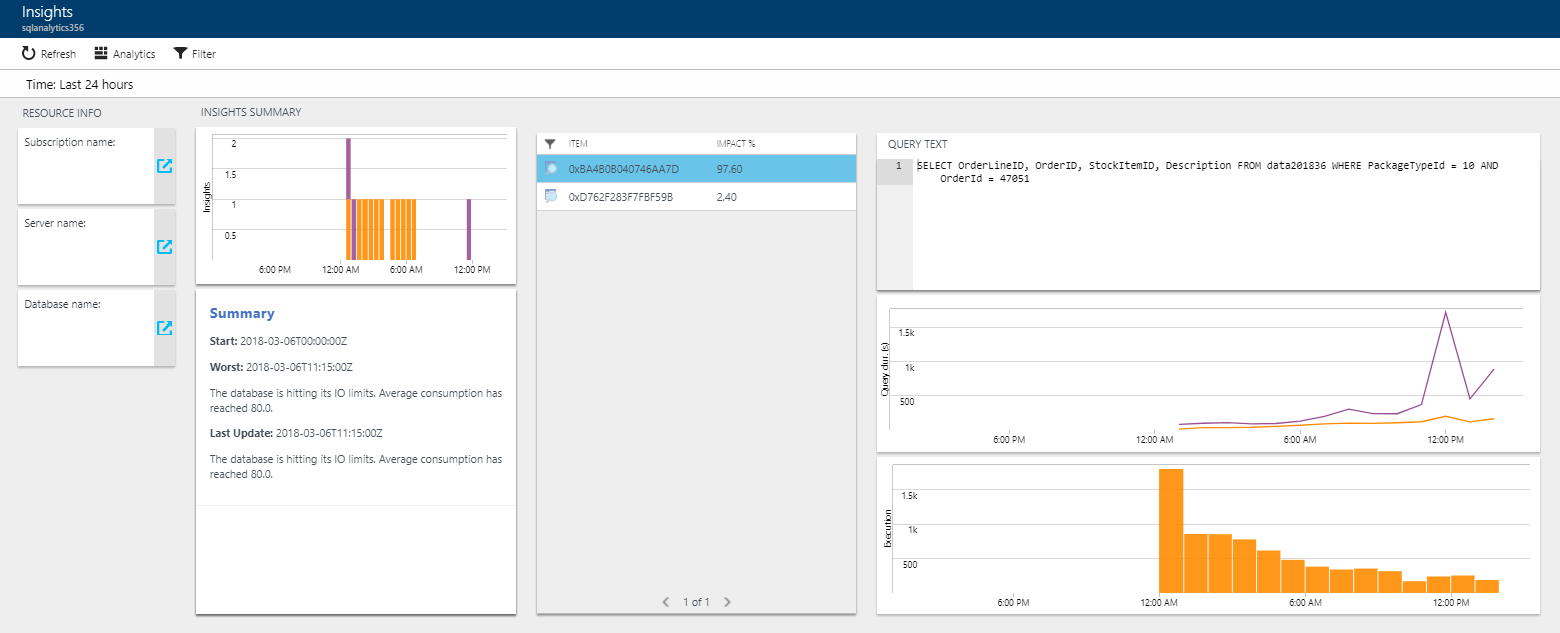
The following example shows an Intelligent Insights viewed through Azure SQL Analytics:

Set up with Event Hubs
To use Intelligent Insights with Event Hubs, configure Intelligent Insights log data to be streamed to Event Hubs, see Metrics and diagnostics logging and Stream Azure diagnostics logs to Event Hubs.
To use Event Hubs to set up custom monitoring and alerting, see What to do with metrics and diagnostics logs in Event Hubs.
Set up with Azure Storage
To use Intelligent Insights with Storage, configure Intelligent Insights log data to be streamed to Storage, see Metrics and diagnostics logging and Stream into Azure Storage.
Custom integrations of Intelligent Insights log
To use Intelligent Insights with third-party tools, or for custom alerting and monitoring development, see Use the Intelligent Insights database performance diagnostics log.
Detection metrics
Metrics used for detection models that generate Intelligent Insights are based on monitoring:
- Query duration
- Timeout requests
- Excessive wait time
- Errored out requests
Query duration and timeout requests are used as primary models in detecting issues with database workload performance. They're used because they directly measure what is happening with the workload. To detect all possible cases of workload performance degradation, excessive wait time and errored-out requests are used as additional models to indicate issues that affect the workload performance.
The system automatically considers changes to the workload and changes in the number of query requests made to the database to dynamically determine normal and out-of-the-ordinary database performance thresholds.
All of the metrics are considered together in various relationships through a scientifically derived data model that categorizes each performance issue detected. Information provided through an intelligent insight includes:
- Details of the performance issue detected.
- A root cause analysis of the issue detected.
- Recommendations on how to improve the performance of the monitored database, where possible.
Query duration
The query duration degradation model analyzes individual queries and detects the increase in the time it takes to compile and execute a query compared to the performance baseline.
If built-in intelligence detects a significant increase in query compile or query execution time that affects workload performance, these queries are flagged as query duration performance degradation issues.
The Intelligent Insights diagnostics log outputs the query hash of the query degraded in performance. The query hash indicates whether the performance degradation was related to query compile or execution time increase, which increased query duration time.
Timeout requests
The timeout requests degradation model analyzes individual queries and detects any increase in timeouts at the query execution level and the overall request timeouts at the database level compared to the performance baseline period.
Some of the queries might time out even before they reach the execution stage. Through the means of aborted workers vs. requests made, built-in intelligence measures and analyzes all queries that reached the database whether they got to the execution stage or not.
After the number of timeouts for executed queries or the number of aborted request workers crosses the system-managed threshold, a diagnostics log is populated with intelligent insights.
The insights generated contain the number of timed-out requests and the number of timed-out queries. Indication of the performance degradation is related to timeout increase at the execution stage, or the overall database level is provided. When the increase in timeouts is deemed significant to database performance, these queries are flagged as timeout performance degradation issues.
Excessive wait times
The excessive wait time model monitors individual database queries. It detects unusually high query wait stats that crossed the system-managed absolute thresholds. The following query excessive wait-time metrics are observed by using, Query Store Wait Stats (sys.query_store_wait_stats):
- Reaching resource limits
- Reaching elastic pool resource limits
- Excessive number of worker or session threads
- Excessive database locking
- Memory pressure
- Other wait stats
Reaching resource limits or elastic pool resource limits denote that consumption of available resources on a subscription or in the elastic pool crossed absolute thresholds. These stats indicate workload performance degradation. An excessive number of worker or session threads denotes a condition in which the number of worker threads or sessions initiated crossed absolute thresholds. These stats indicate workload performance degradation.
Excessive database locking denotes a condition in which the count of locks on a database has crossed absolute thresholds. This stat indicates a workload performance degradation. Memory pressure is a condition in which the number of threads requesting memory grants crossed an absolute threshold. This stat indicates a workload performance degradation.
Other wait stats detection indicates a condition in which miscellaneous metrics measured through the Query Store Wait Stats crossed an absolute threshold. These stats indicate workload performance degradation.
After excessive wait times are detected, depending on the data available, the Intelligent Insights diagnostics log outputs hashes of the affecting and affected queries degraded in performance, details of the metrics that cause queries to wait in execution, and measured wait time.
Errored requests
The errored requests degradation model monitors individual queries and detects an increase in the number of queries that errored out compared to the baseline period. This model also monitors critical exceptions that crossed absolute thresholds managed by built-in intelligence. The system automatically considers the number of query requests made to the database and accounts for any workload changes in the monitored period.
When the measured increase in errored requests relative to the overall number of requests made is deemed significant to workload performance, affected queries are flagged as errored requests performance degradation issues.
The Intelligent Insights log outputs the count of errored requests. It indicates whether the performance degradation was related to an increase in errored requests or to crossing a monitored critical exception threshold and measured time of the performance degradation.
If any of the monitored critical exceptions cross the absolute thresholds managed by the system, an intelligent insight is generated with critical exception details.
Next steps
- Learn how to Monitor databases by using SQL Analytics.
- Learn how to Troubleshoot performance issues with Intelligent Insights.