Tutorial: Collect guest logs and metrics from an Azure virtual machine
To monitor the guest operating system and workloads on an Azure virtual machine, install Azure Monitor Agent and create a data collection rule (DCR) that specifies which data to collect. VM insights installs the agent and collection performance data, but you need to create more DCRs to collect log data such as Windows event logs and Syslog. VM insights also doesn't send guest performance data to Azure Monitor Metrics where it can be analyzed with metrics explorer and used with metrics alerts.
In this tutorial, you learn how to:
- Create a DCR that sends guest performance data to Azure Monitor Metrics and log events to Azure Monitor Logs.
- View guest logs in Log Analytics.
- View guest metrics in metrics explorer.
Prerequisites
To complete this tutorial, you need an Azure virtual machine to monitor.
Important
This tutorial doesn't require VM insights to be enabled for the virtual machine. Azure Monitor Agent is installed on the VM if it isn't already installed.
Create a data collection rule
Data collection rules in Azure Monitor define data to collect and where it should be sent. When you define the DCR by using the Azure portal, you specify the virtual machines it should be applied to. Azure Monitor Agent is automatically installed on any virtual machines that don't already have it.
Note
You must currently install Azure Monitor Agent from the Monitor menu in the Azure portal. This functionality isn't yet available from the virtual machine's menu.
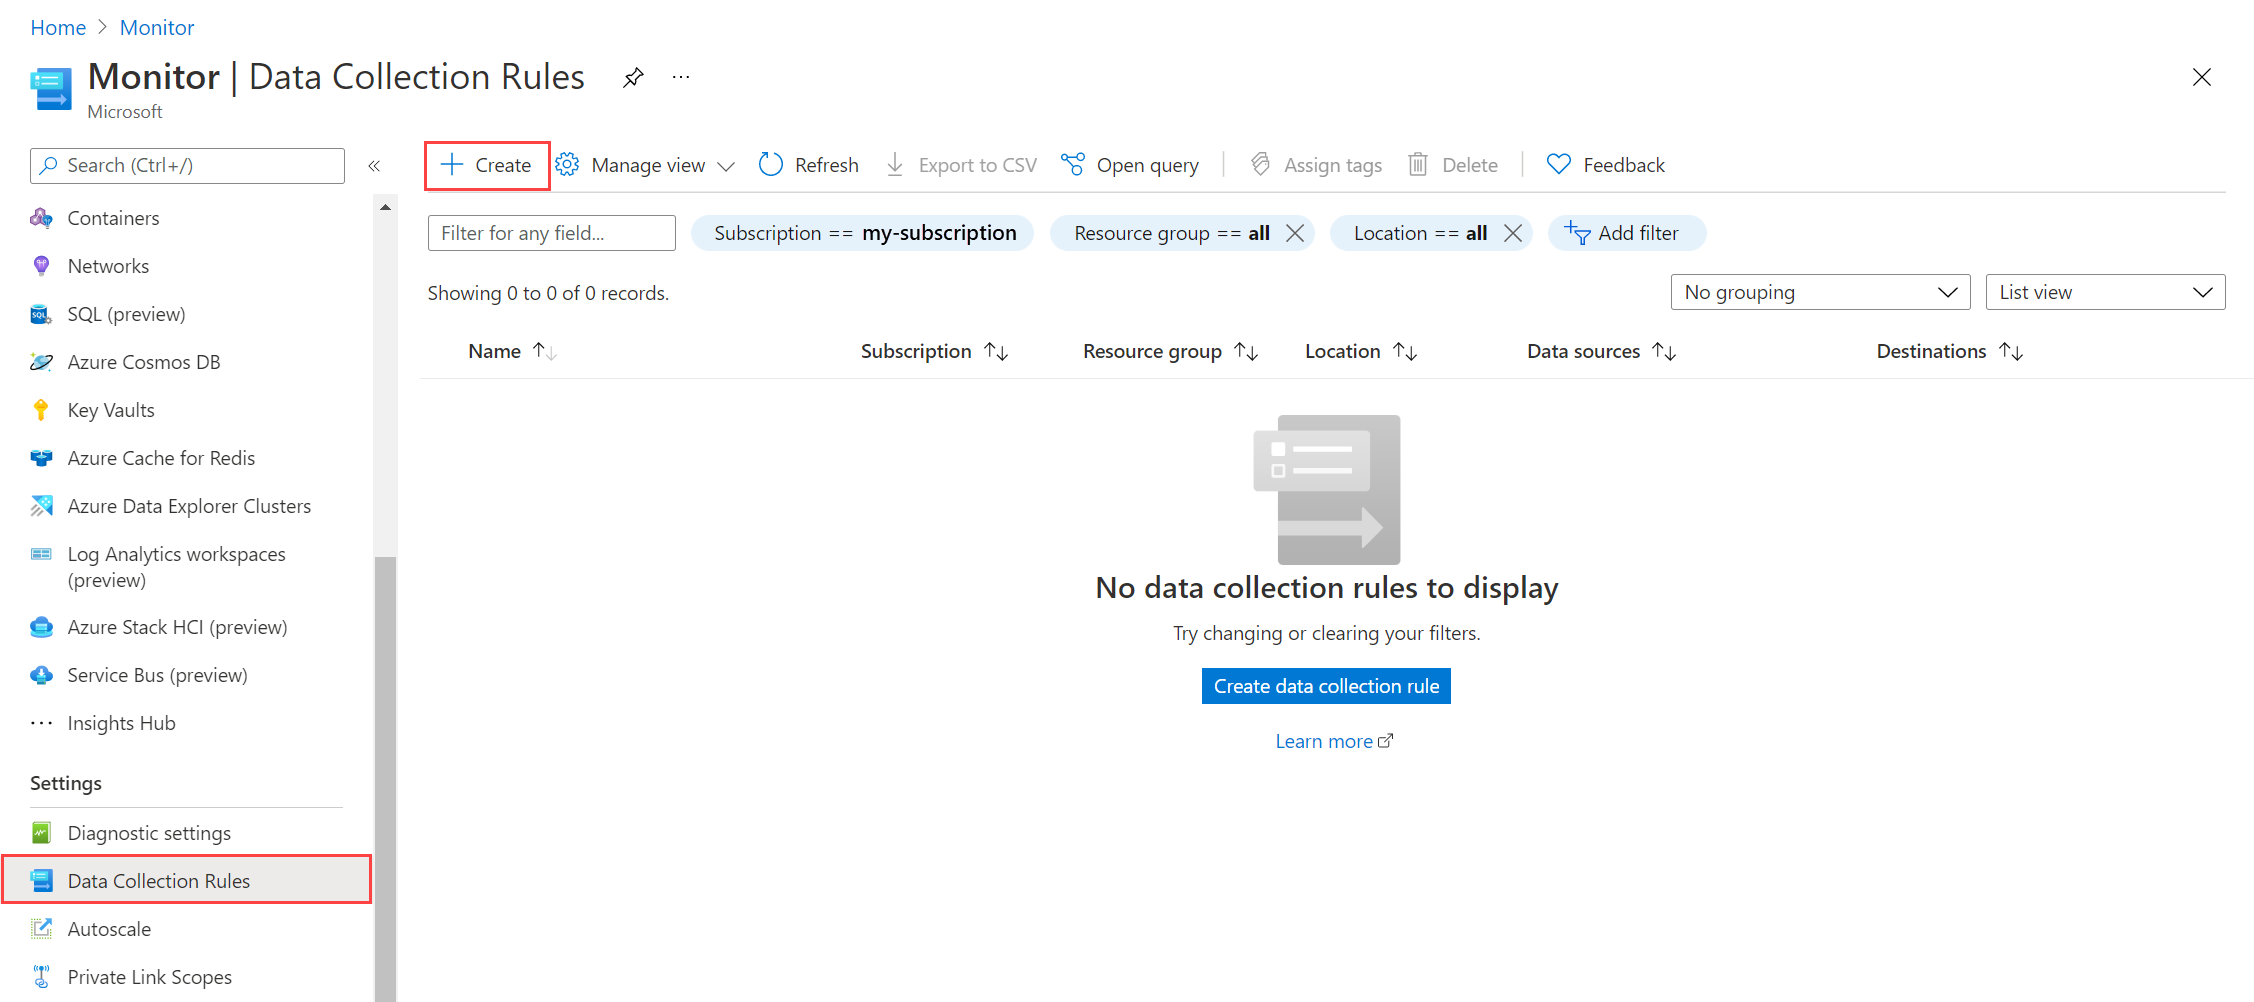
On the Monitor menu in the Azure portal, select Data Collection Rules. Then select Create to create a new DCR.
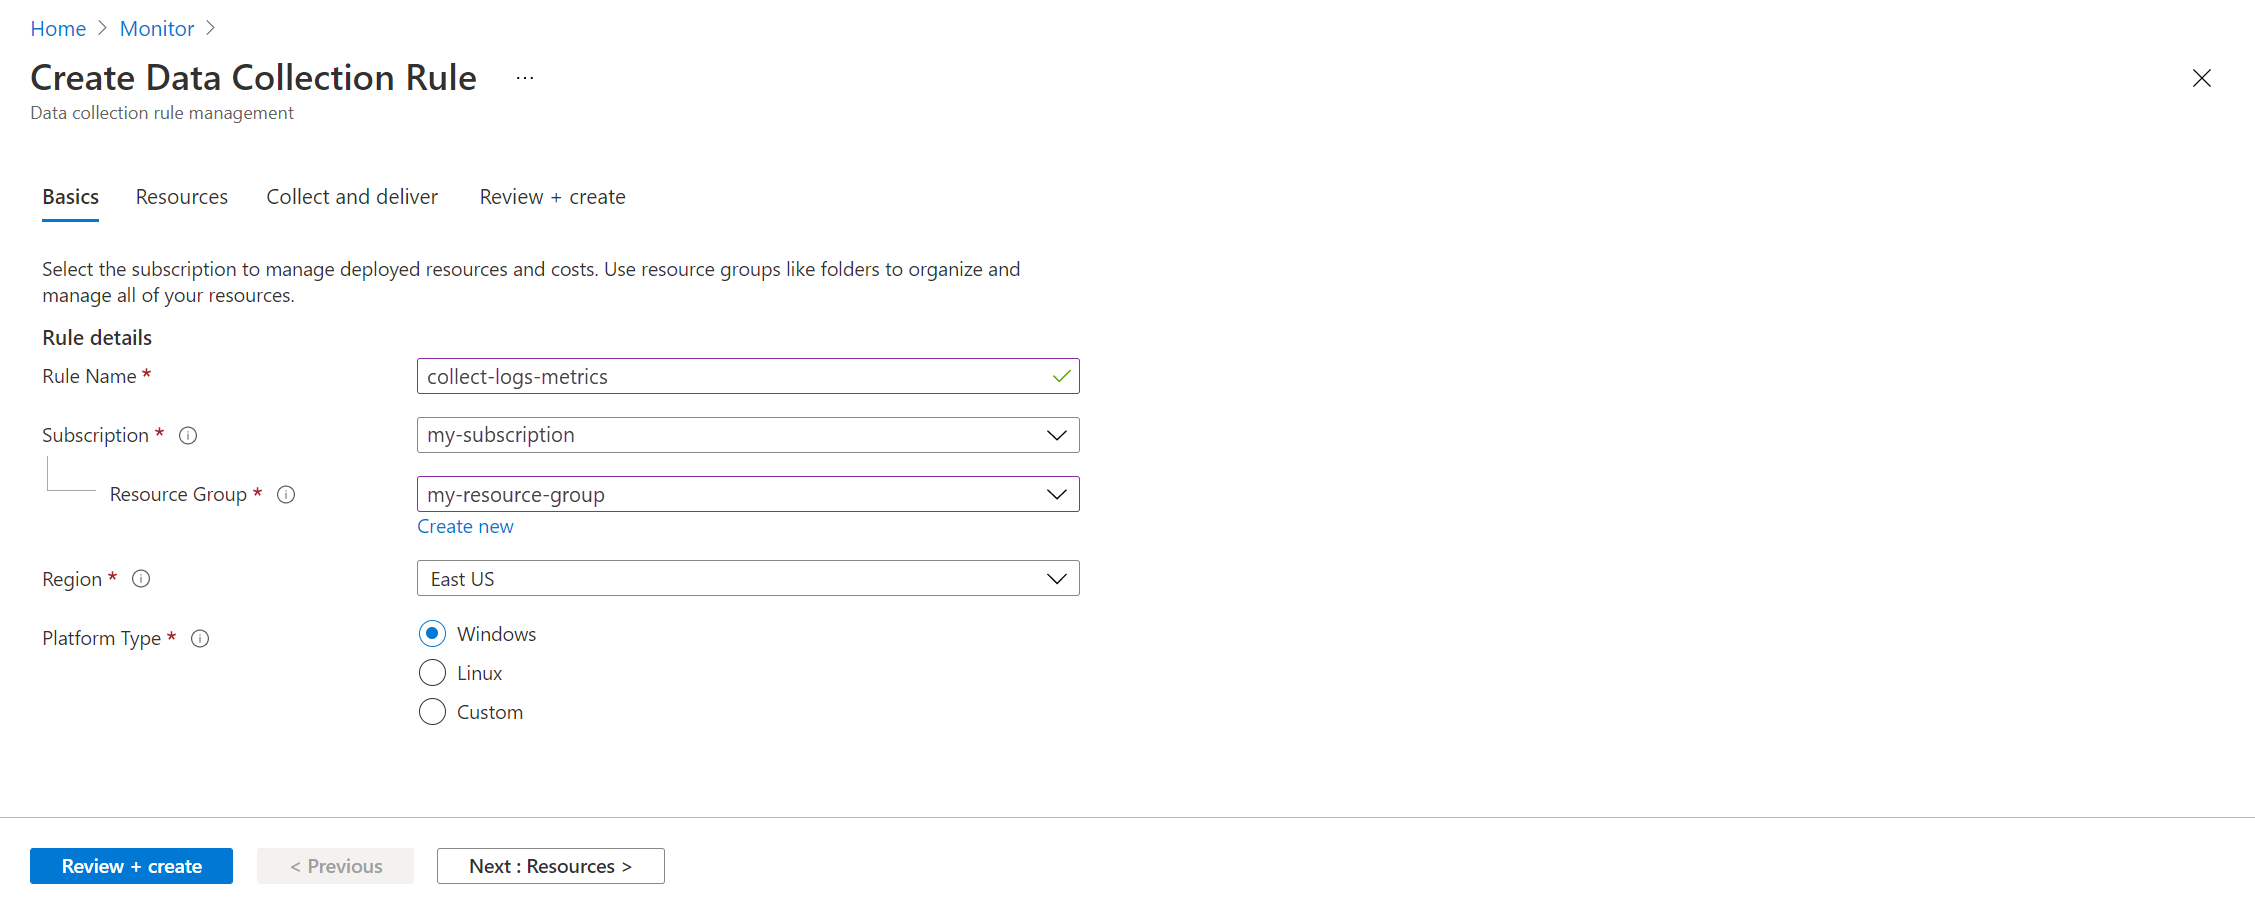
On the Basics tab, enter a Rule Name, which is the name of the rule displayed in the Azure portal. Select a Subscription, Resource Group, and Region where the DCR and its associations are stored. These resources don't need to be the same as the resources being monitored. The Platform Type defines the options that are available as you define the rest of the DCR. Select Windows or Linux if the rule is associated only with those resources or select Custom if it's associated with both types.
Select resources
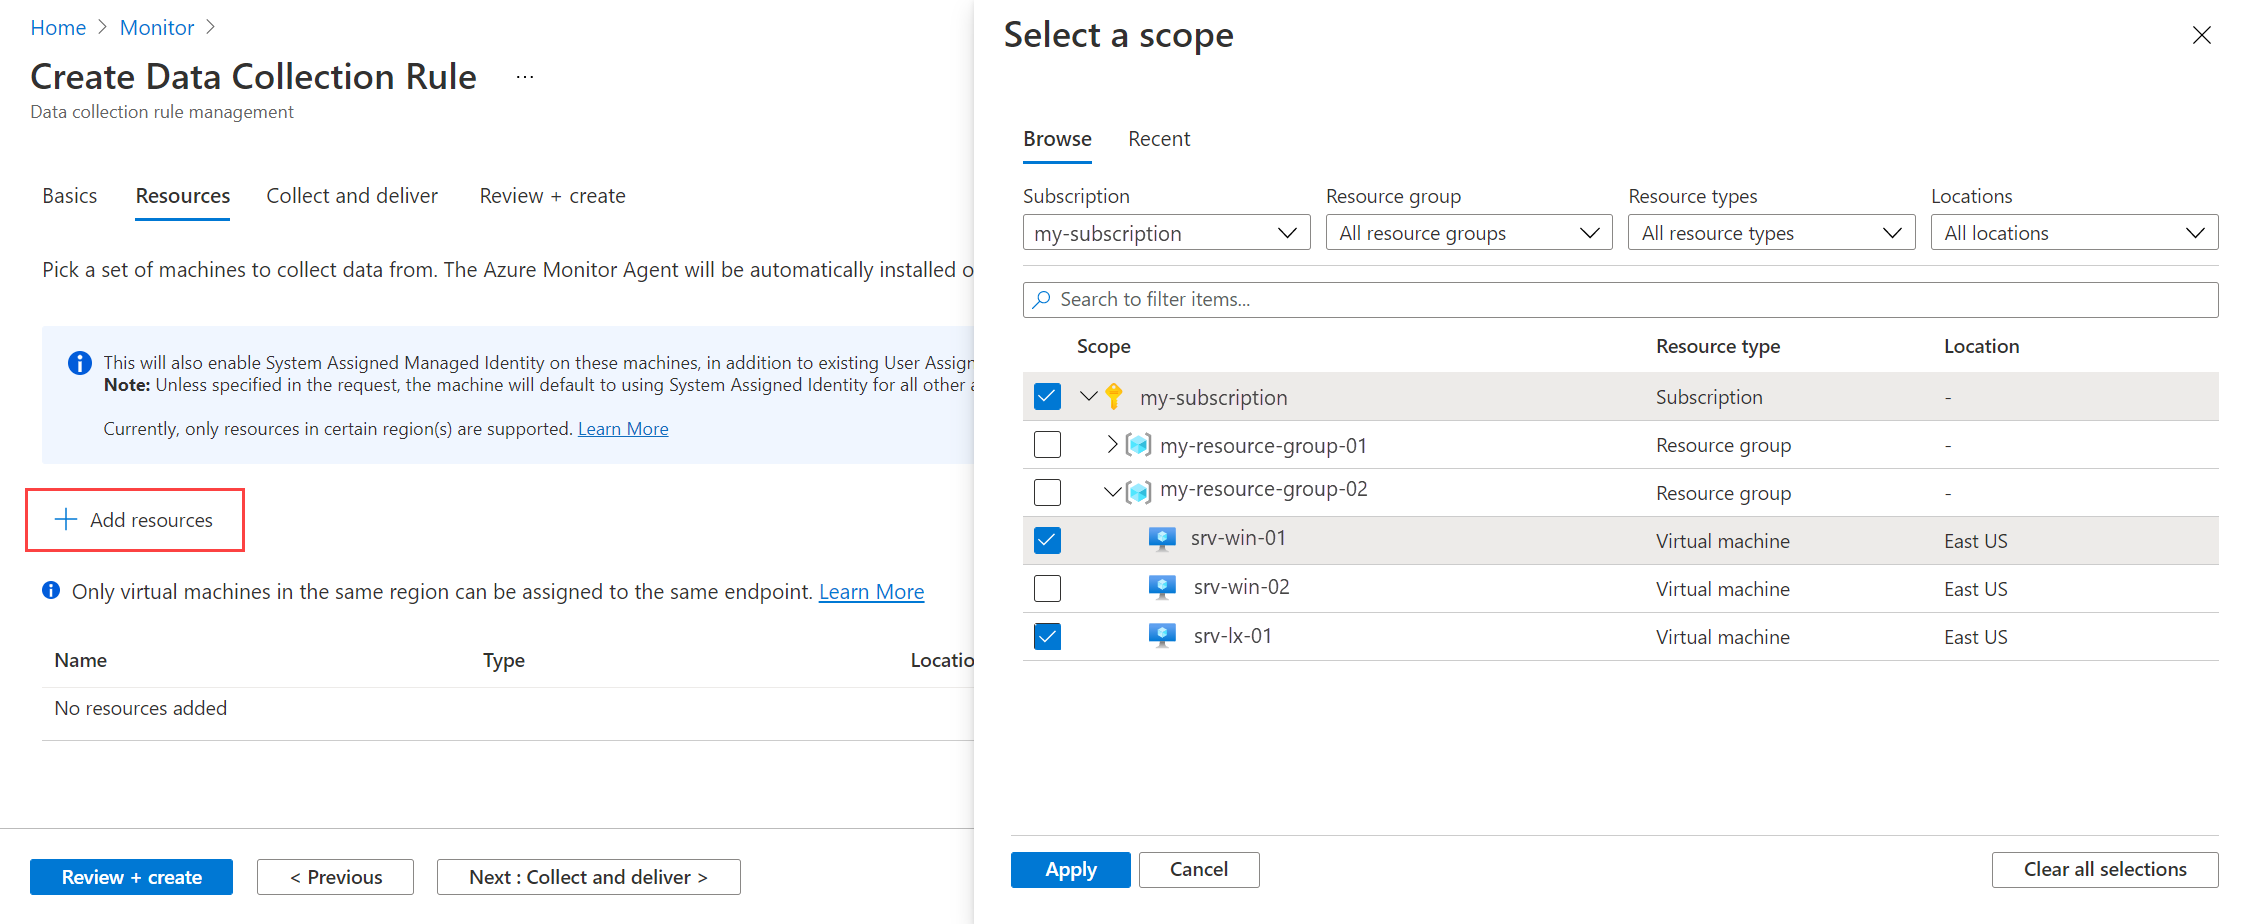
On the Resources tab, identify one or more virtual machines to which the DCR applies. Azure Monitor Agent is installed on any VMs that don't already have it. Select Add resources and select either your virtual machines or the resource group or subscription where your virtual machine is located. The DCR applies to all virtual machines in the selected scope.
Select data sources
A single DCR can have multiple data sources. For this tutorial, we use the same rule to collect both guest metrics and guest logs. We send metrics to Azure Monitor Metrics and to Azure Monitor Logs so that they can both be analyzed with metrics explorer and Log Analytics.
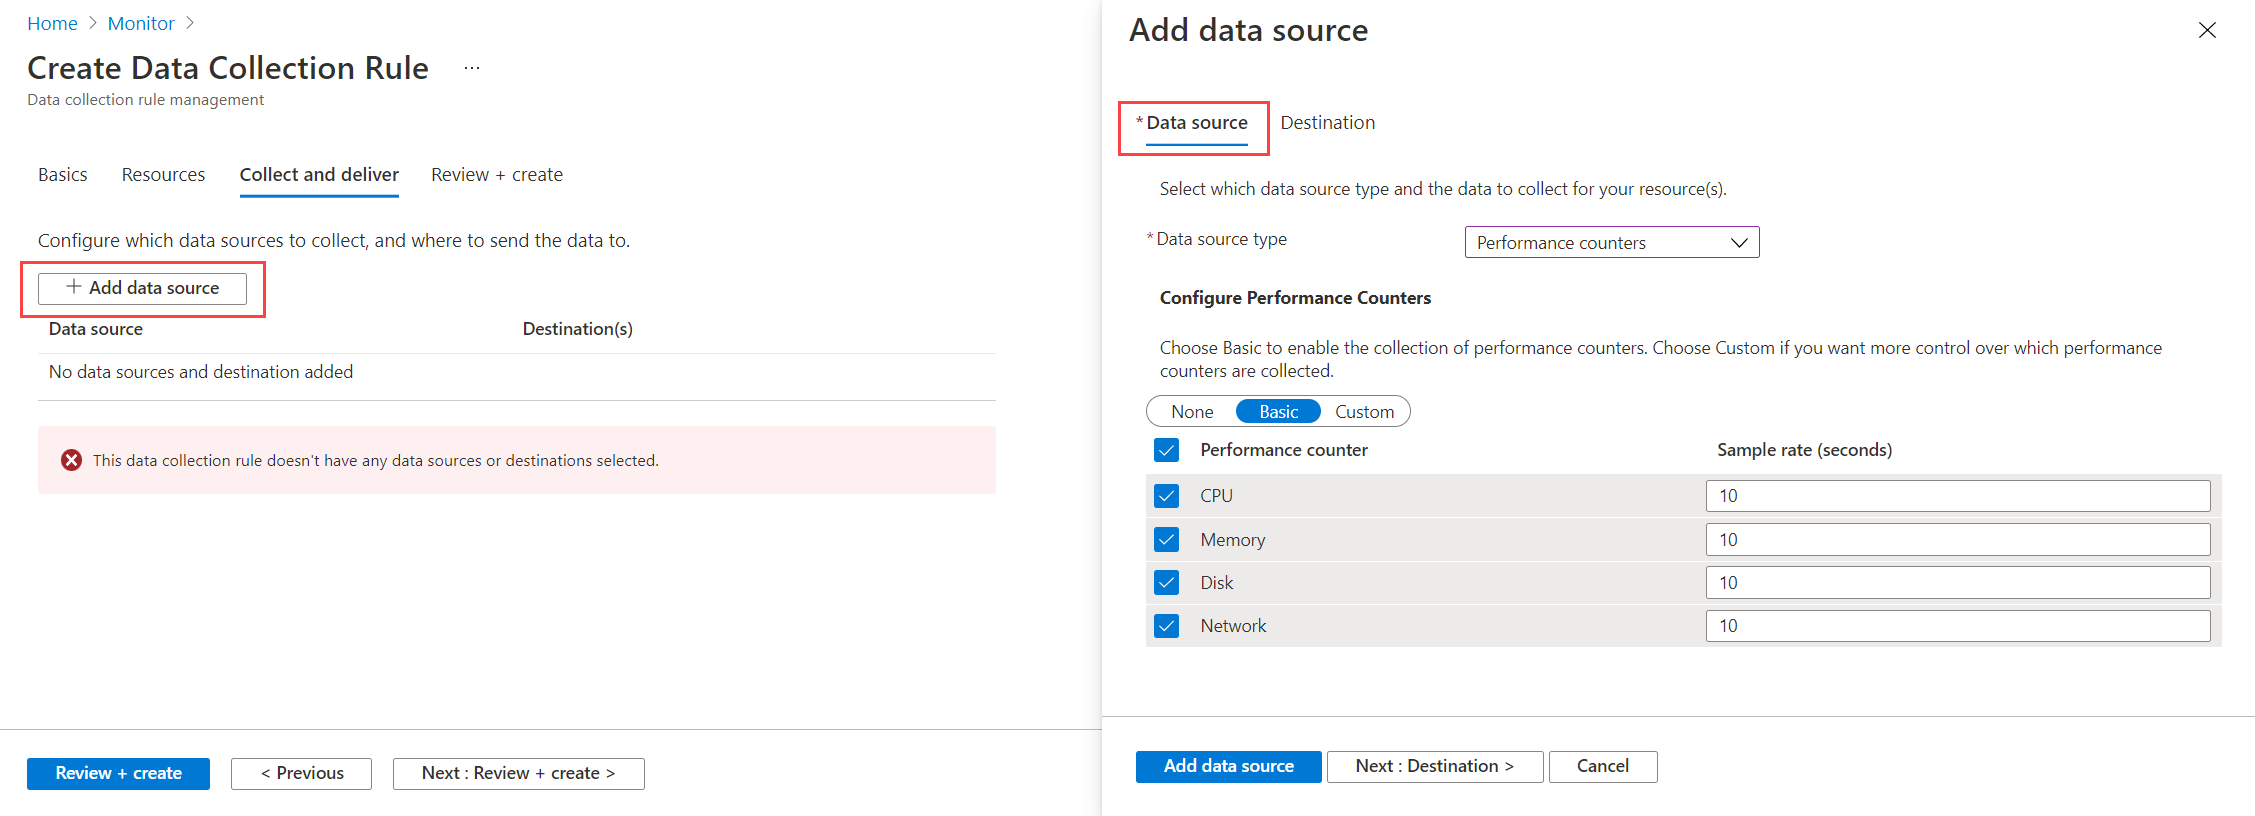
On the Collect and deliver tab, select Add data source. For the Data source type, select Performance counters. Leave the Basic setting and select the counters that you want to collect. Use Custom to select individual metric values.
Select the Destination tab. Azure Monitor Metrics should already be listed. Select Add destination to add another. Select Azure Monitor Logs for Destination type. Select your Log Analytics workspace for Account or namespace. Select Add data source to save the data source.
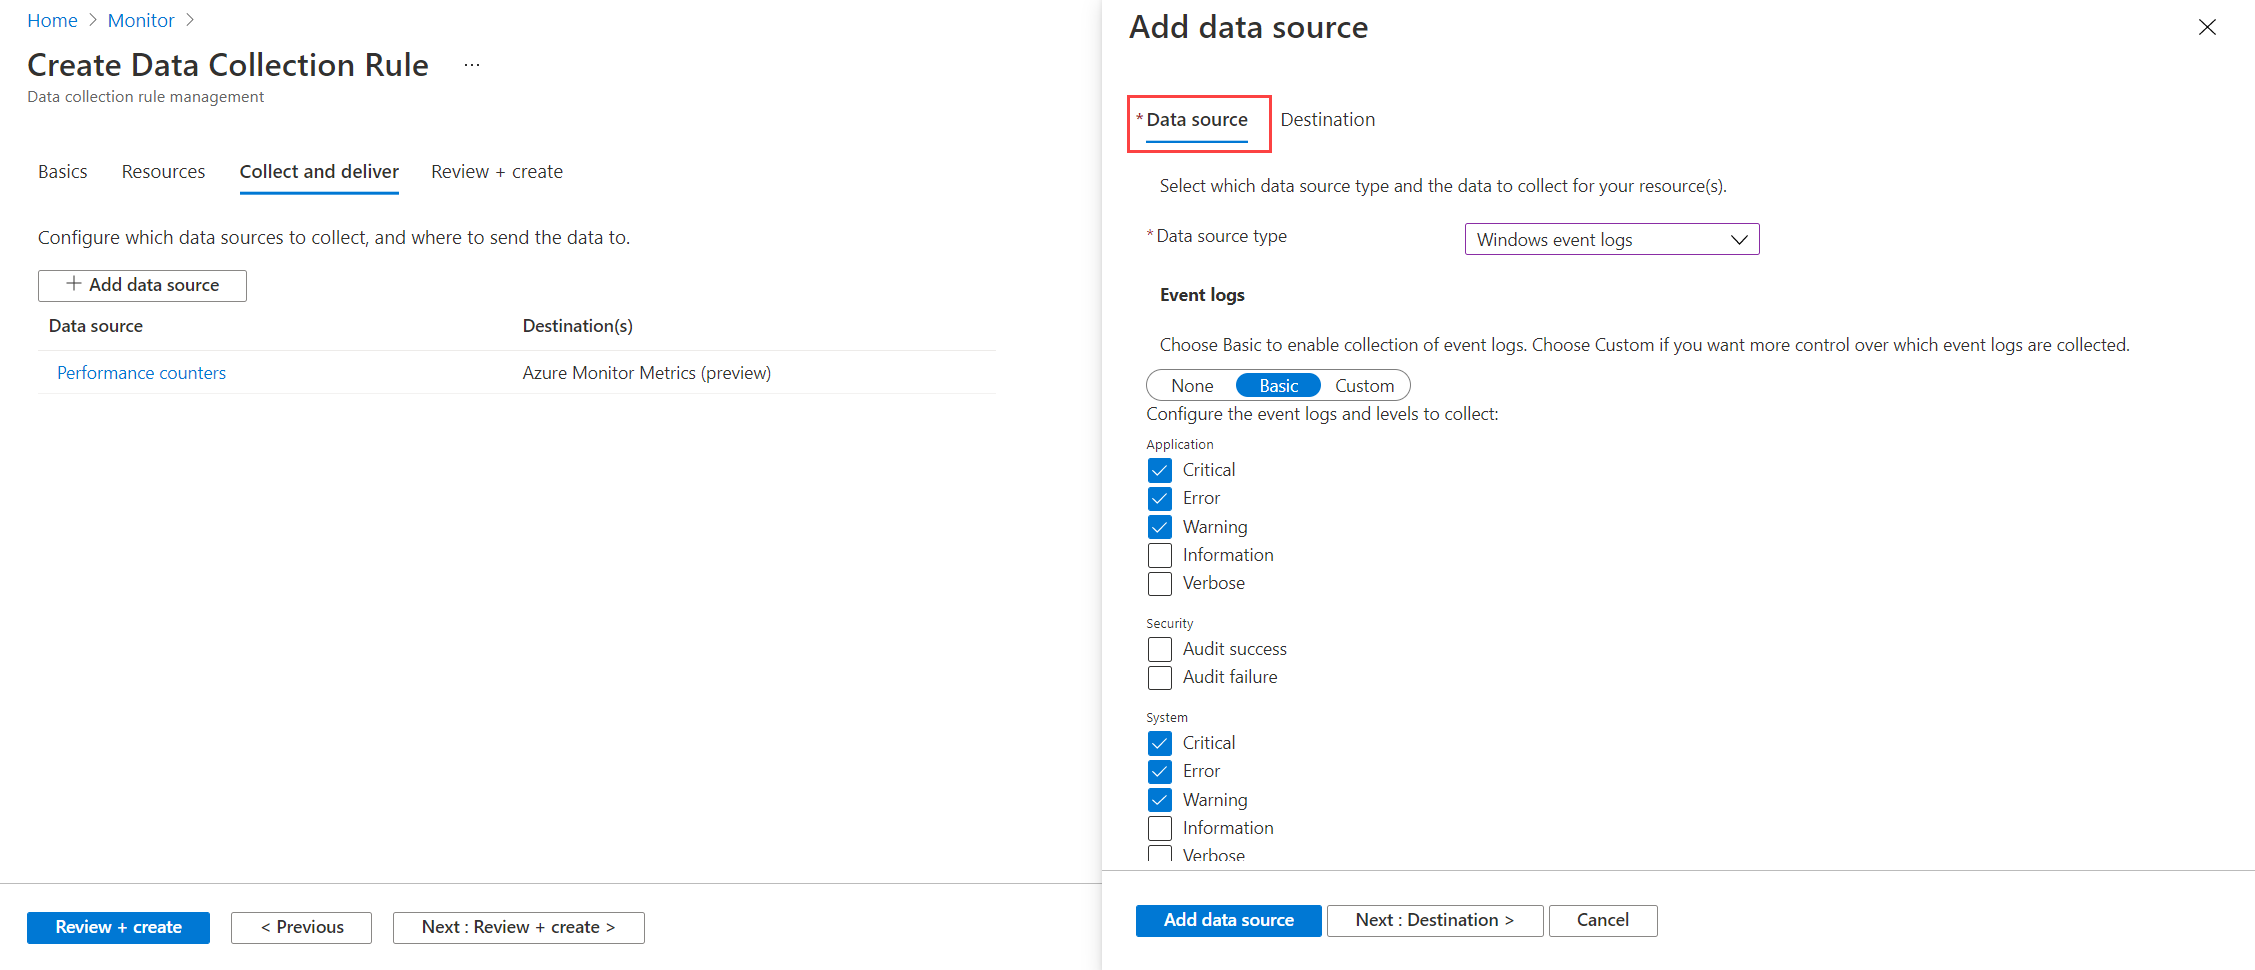
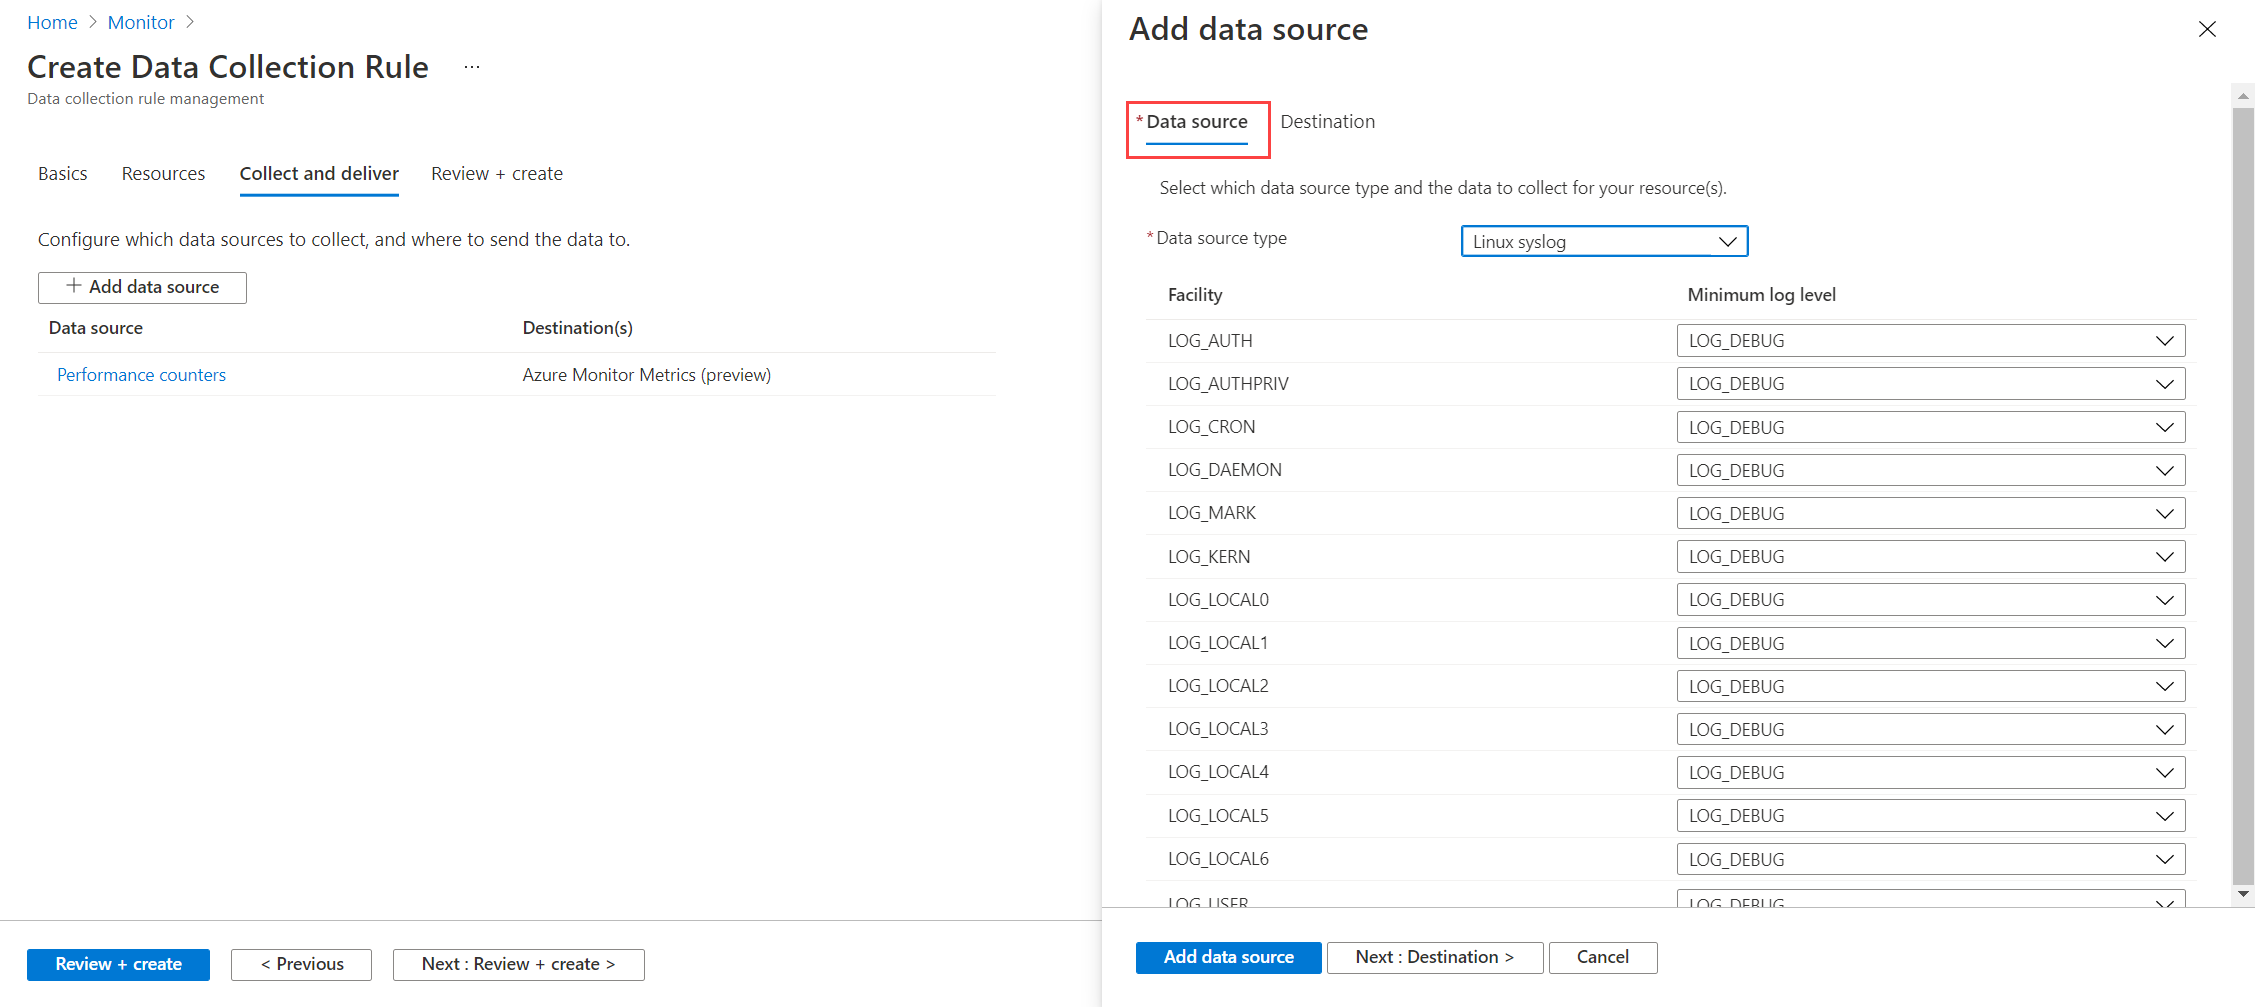
Select Add data source again to add logs to the DCR. For the Data source type, select Windows event logs or Linux syslog. Select the types of log data that you want to collect.
Select the Destination tab. Azure Monitor Logs should already be selected for Destination type. Select your Log Analytics workspace for Account or namespace. If you don't already have a workspace, you can select the default workspace for your subscription, which is automatically created. Select Add data source to save the data source.
Select Review + create to create the DCR and install the Azure Monitor agent on the selected virtual machines.
View logs
Data is retrieved from a Log Analytics workspace by using a log query written in Kusto Query Language. Although a set of precreated queries are available for virtual machines, we use a simple query to have a look at the events that we're collecting.
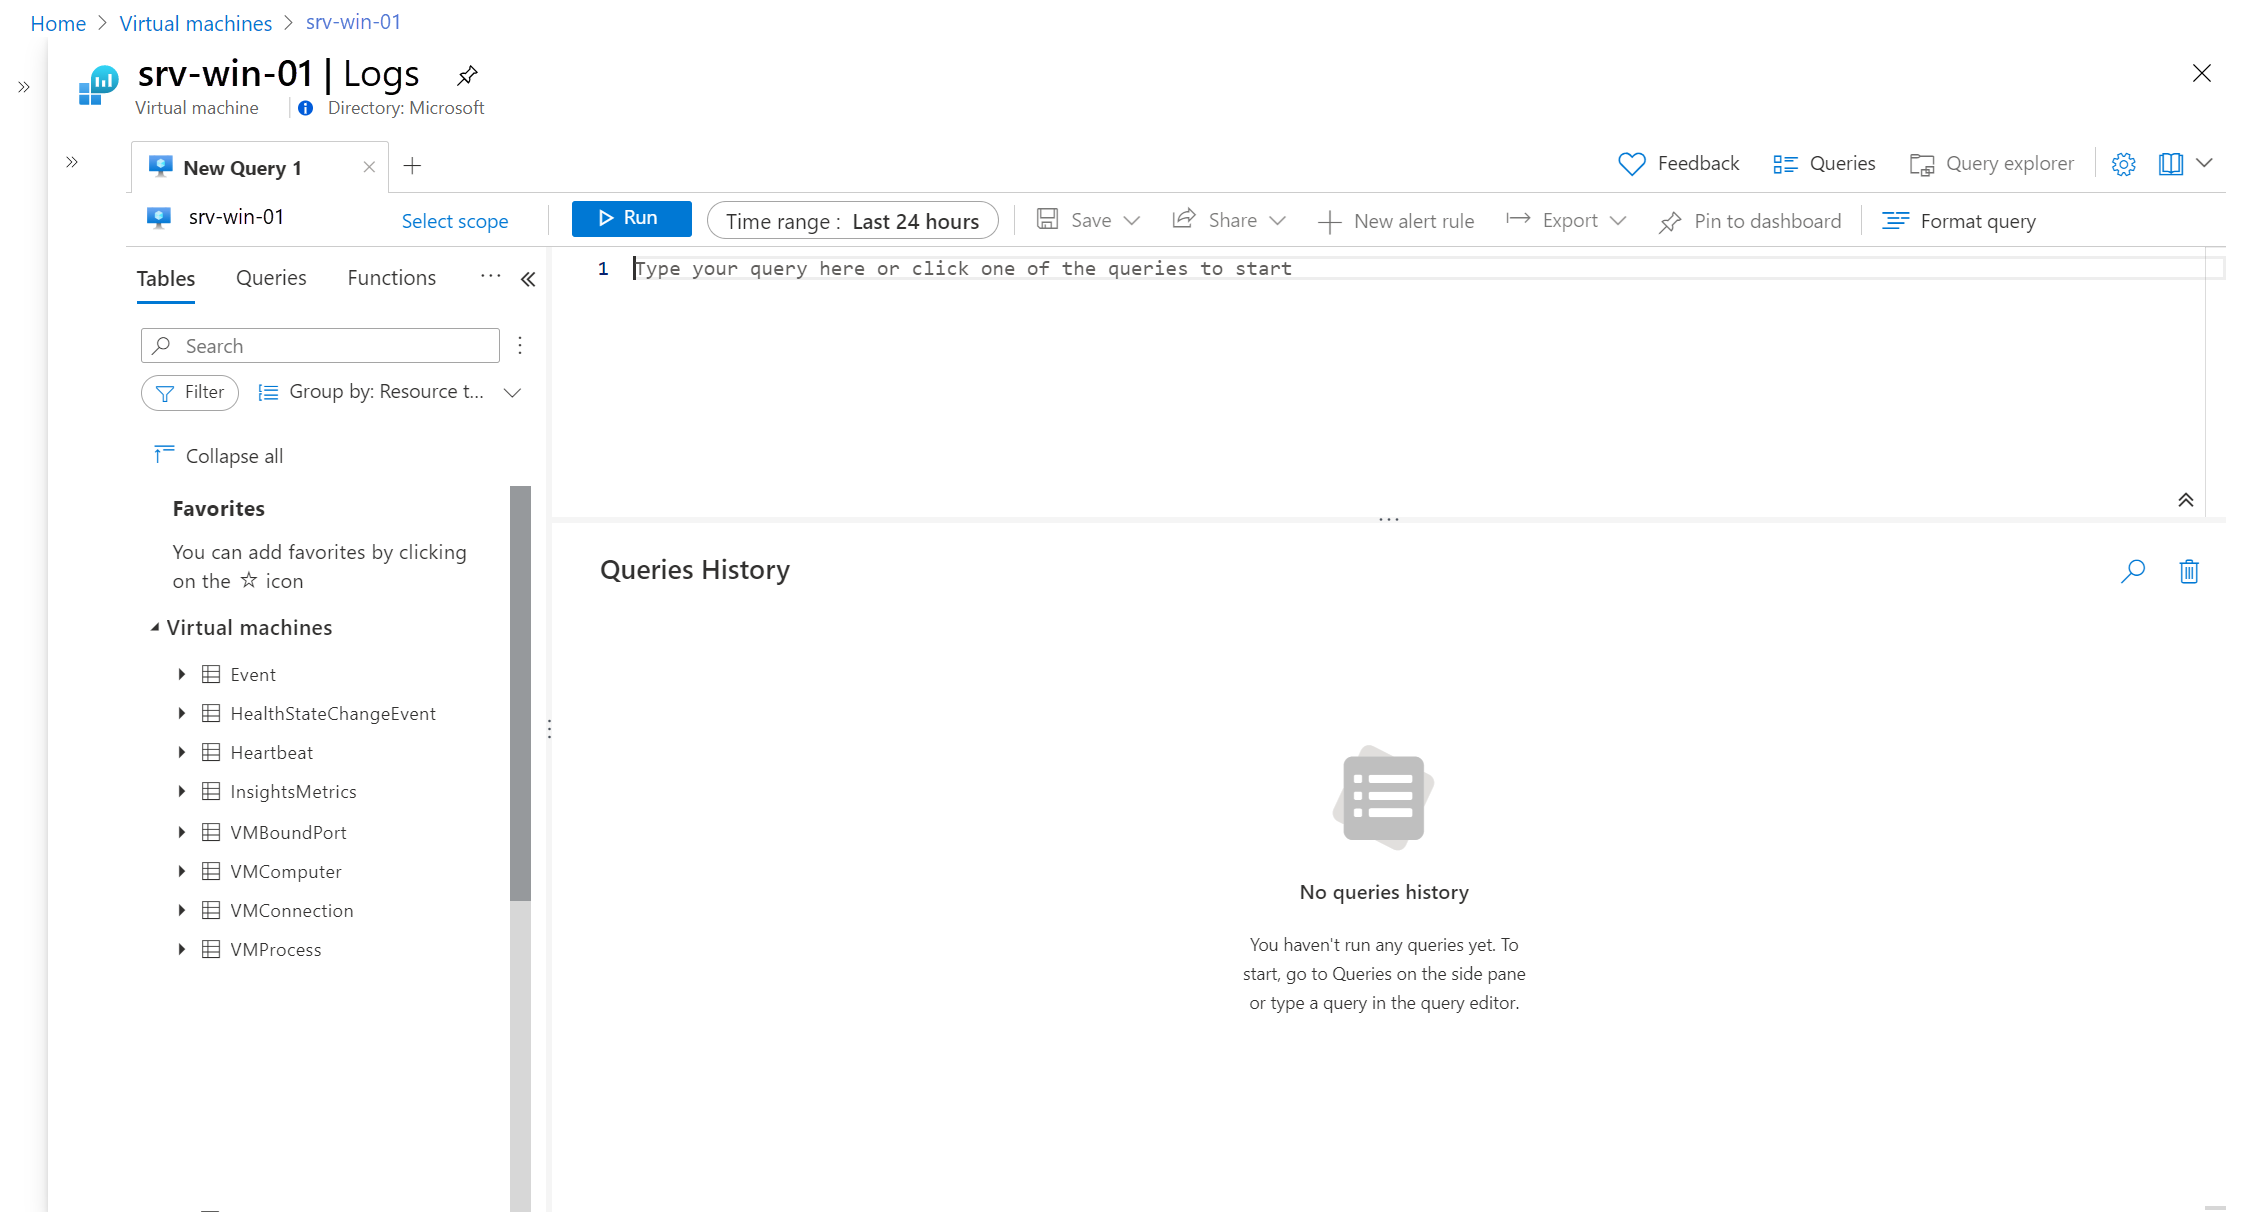
Select Logs from your virtual machine's menu. Log Analytics opens with an empty query window with the scope set to that machine. Any queries include only records collected from that machine.
Note
The Queries window might open when you open Log Analytics. It includes precreated queries that you can use. For now, close this window because we're going to manually create a simple query.
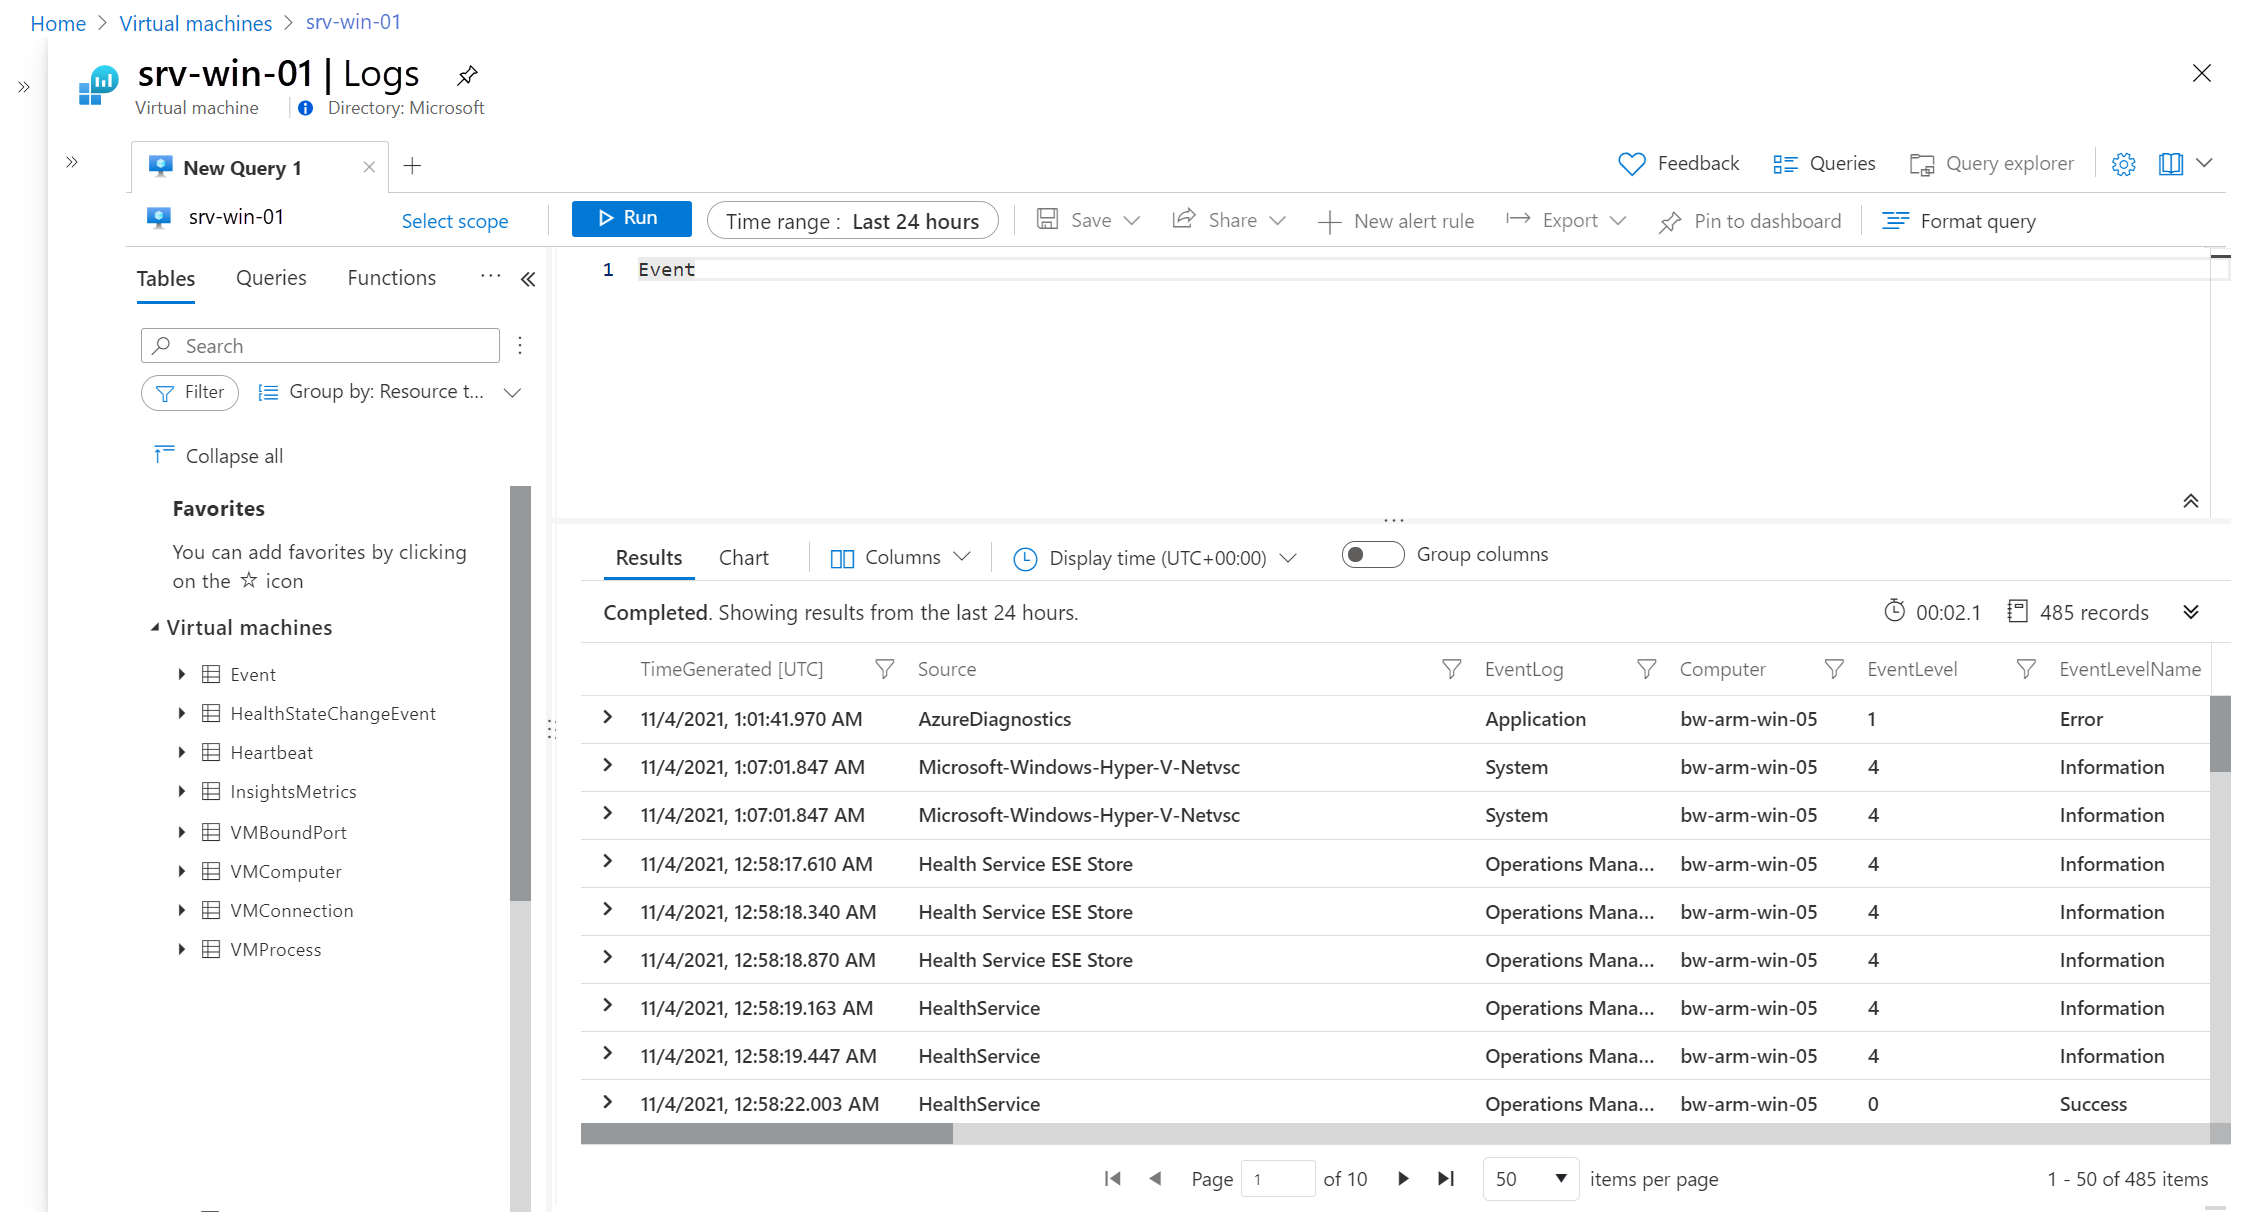
In the empty query window, enter either Event or Syslog depending on whether your machine is running Windows or Linux. Then select Run. The events collected within the Time range are displayed.
Note
If the query doesn't return any data, you might need to wait a few minutes until events are created on the virtual machine to be collected. You might also need to modify the data source in the DCR to include other categories of events.
For a tutorial on using Log Analytics to analyze log data, see Log Analytics tutorial. For a tutorial on creating alert rules from log data, see Tutorial: Create a log search alert for an Azure resource.
View guest metrics
You can view metrics for your host virtual machine with metrics explorer without a DCR like any other Azure resource. With the DCR, you can use metrics explorer to view guest metrics and host metrics.
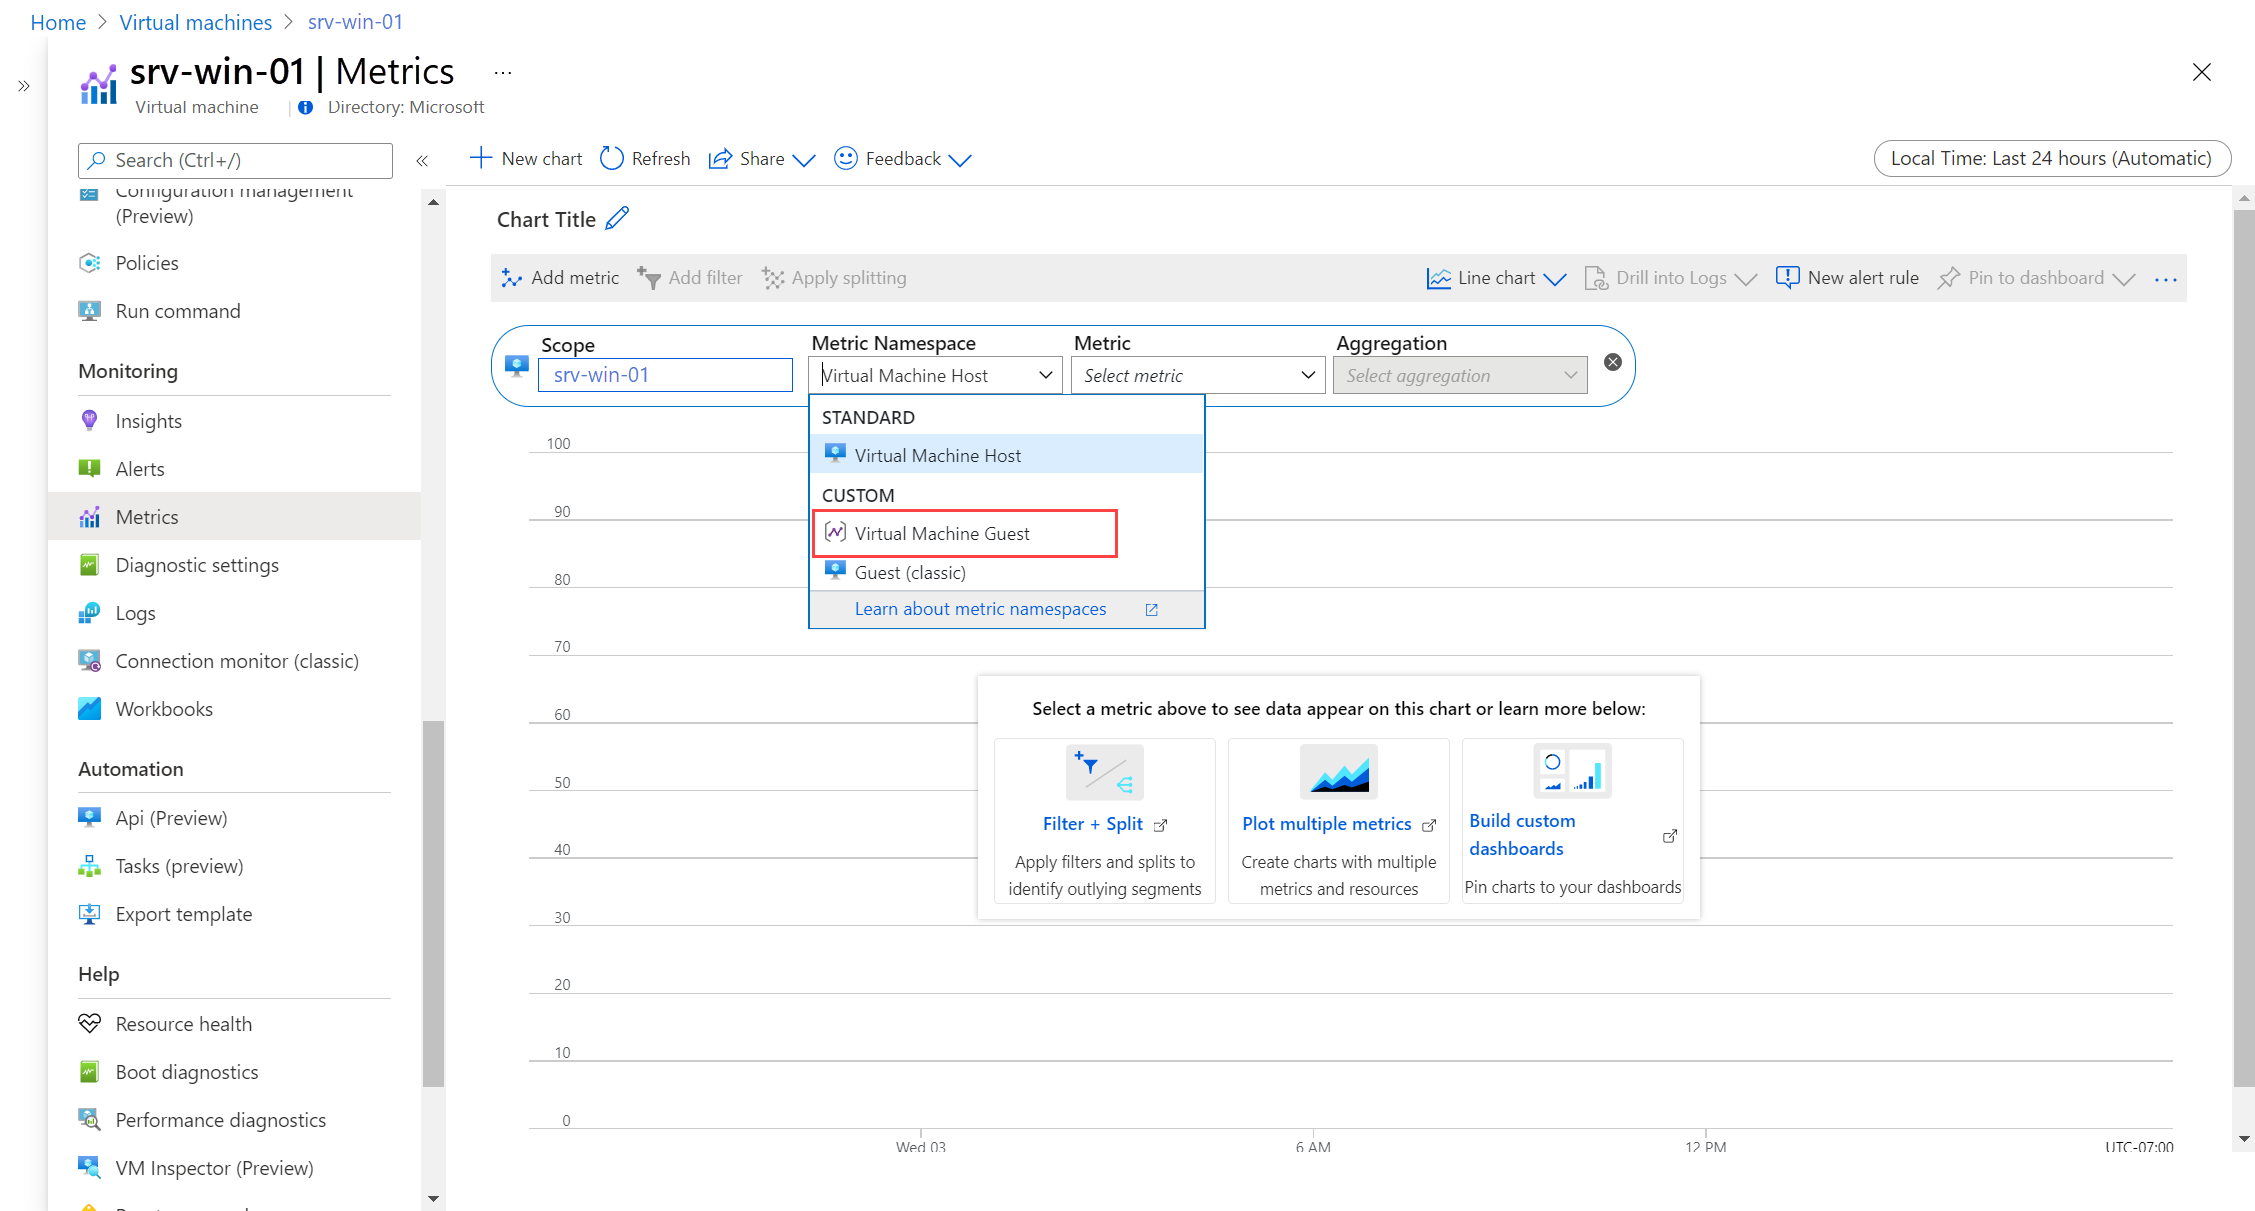
Select Metrics from your virtual machine's menu. Metrics explorer opens with the scope set to your virtual machine. Select Metric Namespace > Virtual Machine Guest.
Note
If you don't see Virtual Machine Guest, you might need to wait a few minutes for the agent to deploy and data to begin collecting.
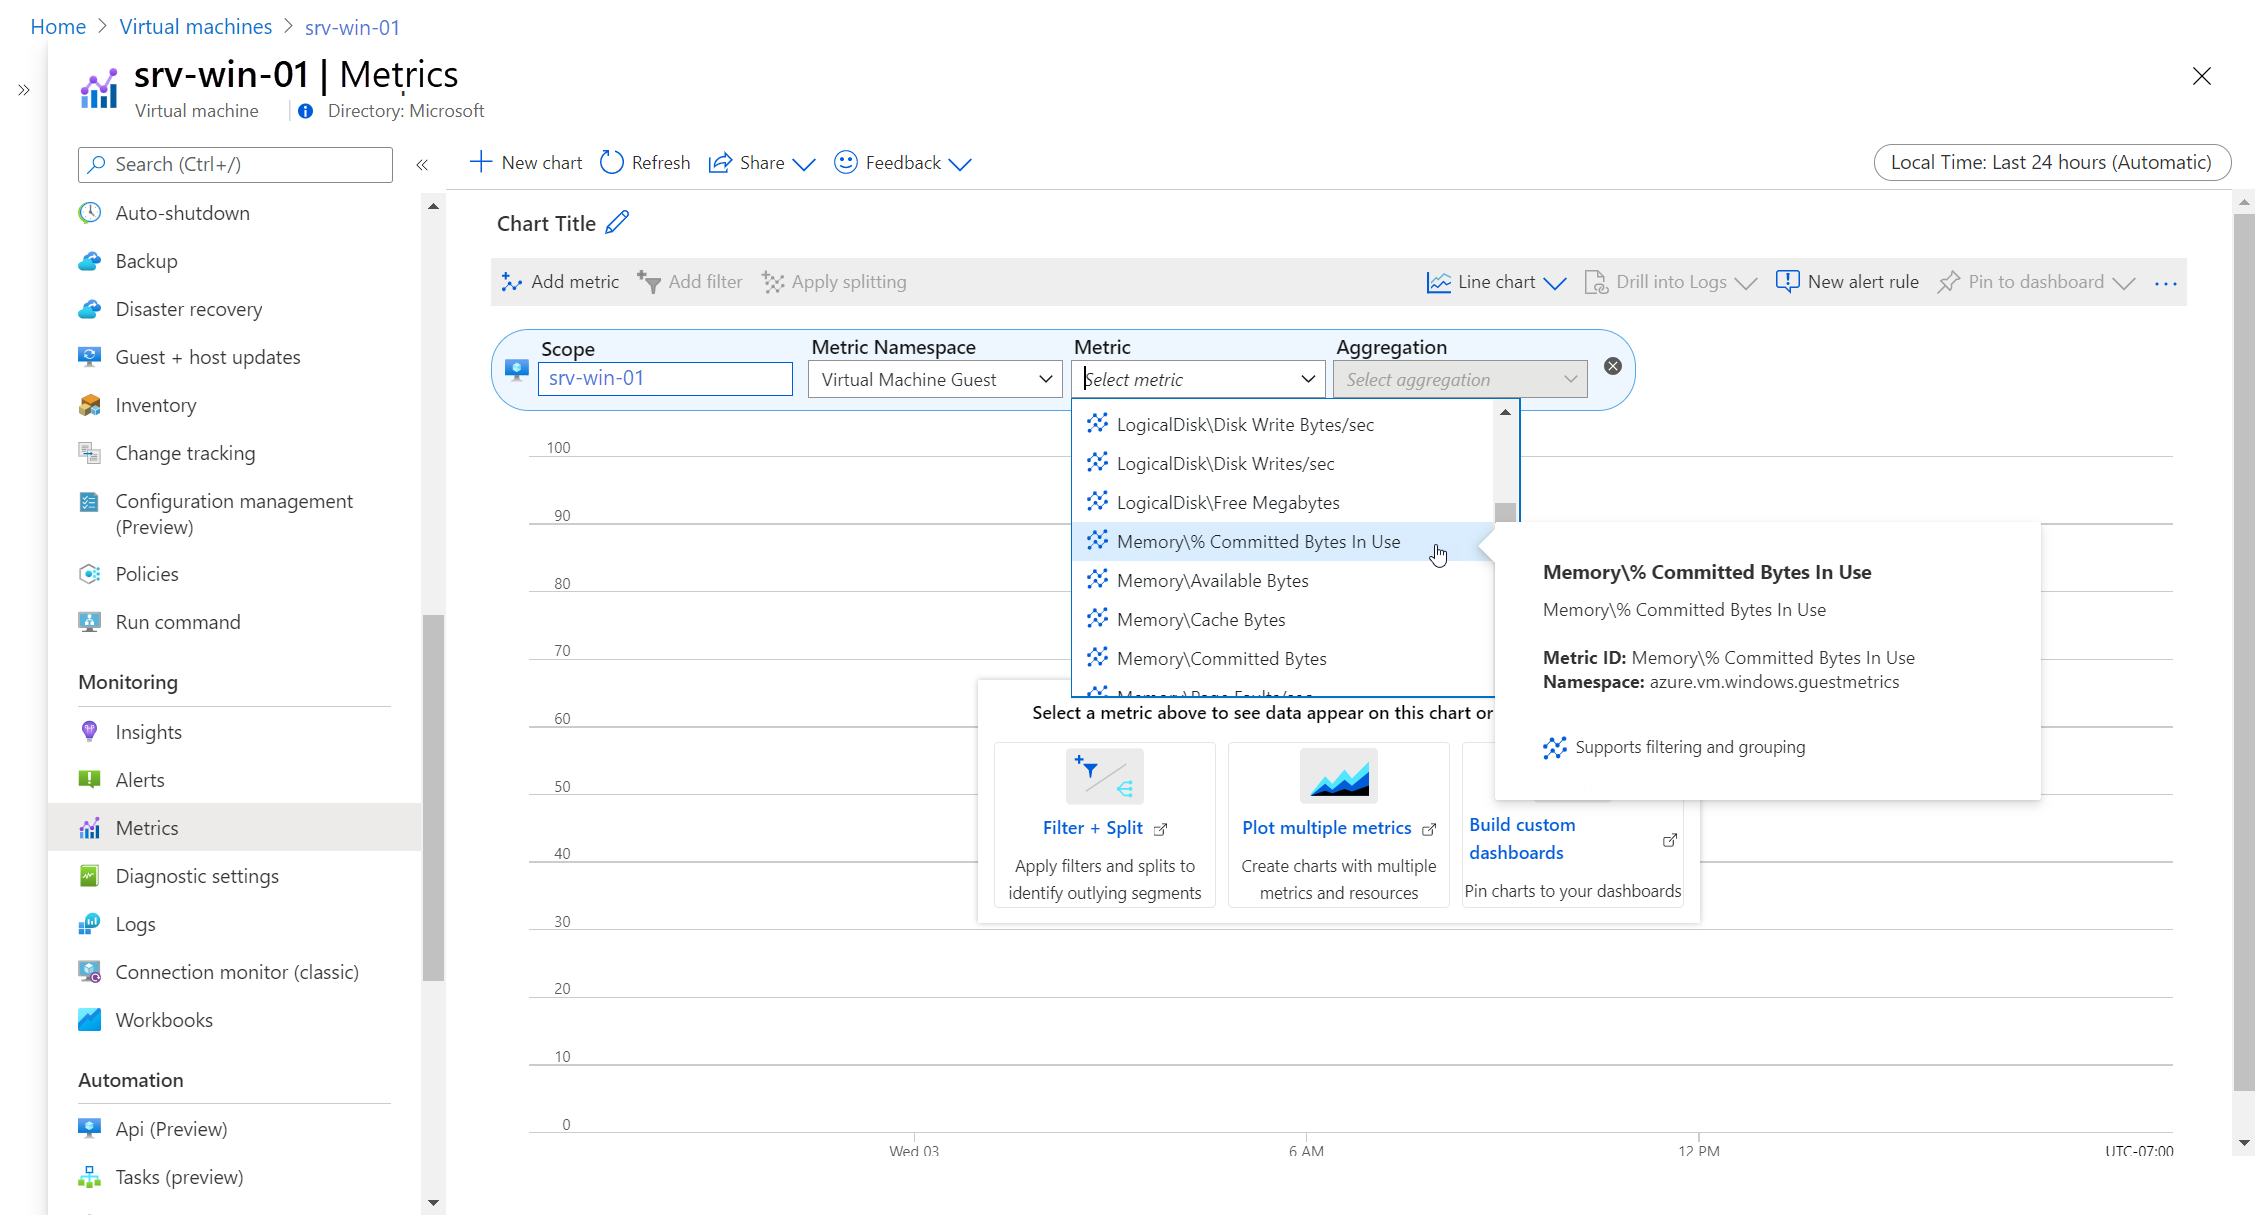
The available guest metrics are displayed. Select a metric to add to the chart.
For a tutorial on how to view and analyze metric data by using metrics explorer, see Tutorial: Analyze metrics for an Azure resource. For a tutorial on how to create metrics alerts, see Tutorial: Create a metric alert for an Azure resource.
Next steps
Recommended alerts and the VM Availability metric alert from the virtual machine host but don't have any visibility into the guest operating system and its workloads. Now that you're collecting guest metrics for the virtual machine, you can create metric alerts based on guest metrics such as logical disk space.
