Export data from a Log Analytics workspace to a storage account by using Logic Apps
This article describes a method to use Azure Logic Apps to query data from a Log Analytics workspace in Azure Monitor and send it to Azure Storage. Use this process when you need to export your Azure Monitor Logs data for auditing and compliance scenarios or to allow another service to retrieve this data.
Other export methods
The method discussed in this article describes a scheduled export from a log query by using a logic app. Other options to export data for particular scenarios include:
- To export data from your Log Analytics workspace to a storage account or Azure Event Hubs, use the Log Analytics workspace data export feature of Azure Monitor Logs. See Log Analytics workspace data export in Azure Monitor.
- One-time export by using a logic app. See Azure Monitor Logs connector for Logic Apps.
- One-time export to a local machine by using a PowerShell script. See Invoke-AzOperationalInsightsQueryExport.
Overview
This procedure uses the Azure Monitor Logs connector, which lets you run a log query from a logic app and use its output in other actions in the workflow. The Azure Blob Storage connector is used in this procedure to send the query output to storage.
When you export data from a Log Analytics workspace, limit the amount of data processed by your Logic Apps workflow. Filter and aggregate your log data in the query to reduce the required data. For example, if you need to export sign-in events, filter for required events and project only the required fields. For example:
SecurityEvent
| where EventID == 4624 or EventID == 4625
| project TimeGenerated , Account , AccountType , Computer
When you export the data on a schedule, use the ingestion_time() function in your query to ensure that you don't miss late-arriving data. If data is delayed because of network or platform issues, using the ingestion time ensures that data is included in the next Logic Apps execution. For an example, see the step "Add Azure Monitor Logs action" in the Logic Apps procedure section.
Prerequisites
The following prerequisites must be completed before you start this procedure:
- Log Analytics workspace: The user who creates the logic app must have at least read permission to the workspace.
- Storage account: The storage account doesn't have to be in the same subscription as your Log Analytics workspace. The user who creates the logic app must have write permission to the storage account.
Connector limits
Log Analytics workspace and log queries in Azure Monitor are multitenancy services that include limits to protect and isolate customers and maintain quality of service. When you query for a large amount of data, consider the following limits, which can affect how you configure the Logic Apps recurrence and your log query:
- Log queries can't return more than 500,000 rows.
- Log queries can't return more than 64,000,000 bytes.
- Log queries can't run longer than 10 minutes.
- Log Analytics connector is limited to 100 calls per minute.
Logic Apps procedure
The following sections walk you through the procedure.
Create a container in the storage account
Use the procedure in Create a container to add a container to your storage account to hold the exported data. The name used for the container in this article is loganalytics-data, but you can use any name.
Create a logic app workflow
Go to Logic Apps in the Azure portal and select Add. Select a Subscription, Resource group, and Region to store the new logic app. Then give it a unique name. You can turn on the Log Analytics setting to collect information about runtime data and events as described in Set up Azure Monitor Logs and collect diagnostics data for Azure Logic Apps. This setting isn't required for using the Azure Monitor Logs connector.
Select Review + create and then select Create. After the deployment is finished, select Go to resource to open the Logic Apps Designer.
Create a trigger for the workflow
Under Start with a common trigger, select Recurrence. This setting creates a logic app workflow that automatically runs at a regular interval. In the Frequency box of the action, select Day. In the Interval box, enter 1 to run the workflow once per day.
Add an Azure Monitor Logs action
The Azure Monitor Logs action lets you specify the query to run. The log query used in this example is optimized for hourly recurrence. It collects the data ingested for the particular execution time. For example, if the workflow runs at 4:35, the time range would be 3:00 to 4:00. If you change the logic app to run at a different frequency, you need to change the query too. For example, if you set the recurrence to run daily, you set startTime in the query to startofday(make_datetime(year,month,day,0,0)).
You're prompted to select a tenant to grant access to the Log Analytics workspace with the account that the workflow will use to run the query.
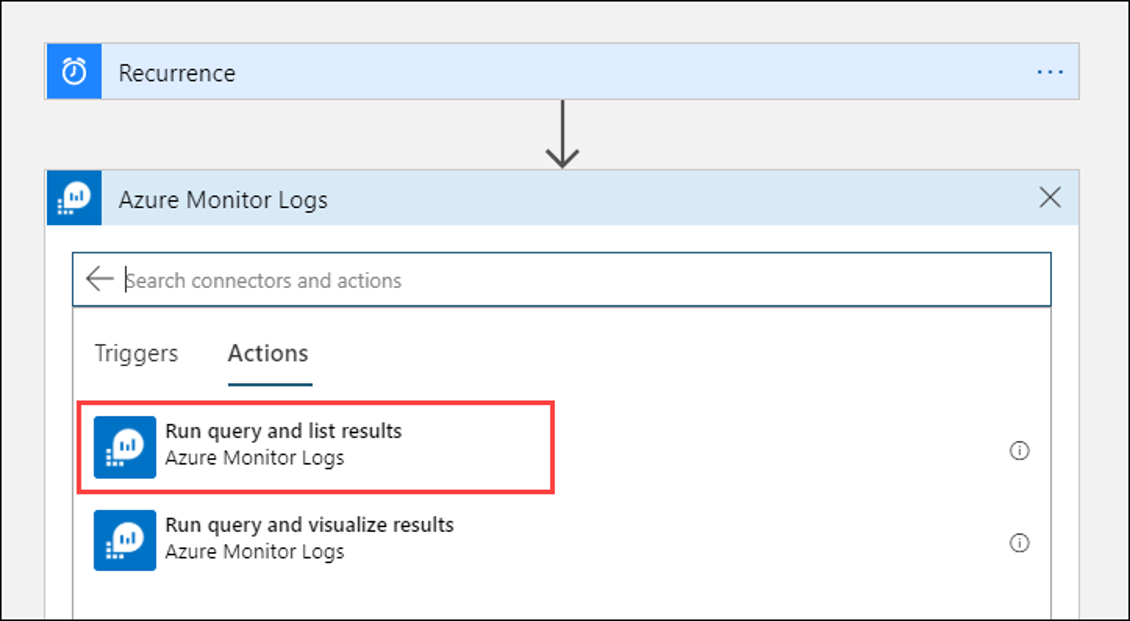
Select + New step to add an action that runs after the recurrence action. Under Choose an action, enter azure monitor. Then select Azure Monitor Logs.
Select Azure Log Analytics – Run query and list results.
Select the Subscription and Resource Group for your Log Analytics workspace. Select Log Analytics Workspace for the Resource Type. Then select the workspace name under Resource Name.
Add the following log query to the Query window:
let dt = now();
let year = datetime_part('year', dt);
let month = datetime_part('month', dt);
let day = datetime_part('day', dt);
 let hour = datetime_part('hour', dt);
let startTime = make_datetime(year,month,day,hour,0)-1h;
let endTime = startTime + 1h - 1tick;
AzureActivity
| where ingestion_time() between(startTime .. endTime)
| project
    TimeGenerated,
    BlobTime = startTime,
    OperationName ,
    OperationNameValue ,
    Level ,
    ActivityStatus ,
    ResourceGroup ,
    SubscriptionId ,
    Category ,
    EventSubmissionTimestamp ,
    ClientIpAddress = parse_json(HTTPRequest).clientIpAddress ,
    ResourceId = _ResourceId
The Time Range specifies the records that will be included in the query based on the TimeGenerated column. The value should be greater than the time range selected in the query. Because this query isn't using the TimeGenerated column, the Set in query option isn't available. For more information about the time range, see Query scope. Select Last 4 hours for the Time Range. This setting ensures that any records with an ingestion time larger than TimeGenerated will be included in the results.
Add a Parse JSON action (optional)
The output from the Run query and list results action is formatted in JSON. You can parse this data and manipulate it as part of the preparation for the Compose action.
You can provide a JSON schema that describes the payload you expect to receive. The designer parses JSON content by using this schema and generates user-friendly tokens that represent the properties in your JSON content. You can then easily reference and use those properties throughout your Logic App's workflow.
You can use a sample output from the Run query and list results step.
Select Run Trigger in the Logic Apps ribbon. Then select Run and download and save an output record. For the sample query in the previous stem, you can use the following sample output:
{
    "TimeGenerated": "2020-09-29T23:11:02.578Z",
    "BlobTime": "2020-09-29T23:00:00Z",
    "OperationName": "Returns Storage Account SAS Token",
    "OperationNameValue": "MICROSOFT.RESOURCES/DEPLOYMENTS/WRITE",
    "Level": "Informational",
    "ActivityStatus": "Started",
    "ResourceGroup": "monitoring",
    "SubscriptionId": "aaaa0a0a-bb1b-cc2c-dd3d-eeeeee4e4e4e",
    "Category": "Administrative",
    "EventSubmissionTimestamp": "2020-09-29T23:11:02Z",
    "ClientIpAddress": "192.168.1.100",
    "ResourceId": "/subscriptions/aaaa0a0a-bb1b-cc2c-dd3d-eeeeee4e4e4e/resourcegroups/monitoring/providers/microsoft.storage/storageaccounts/my-storage-account"
}
Select + New step and then select + Add an action. Under Choose an operation, enter json and then select Parse JSON.
Select the Content box to display a list of values from previous activities. Select Body from the Run query and list results action. This output is from the log query.
Copy the sample record saved earlier. Select Use sample payload to generate schema and paste.
Add the Compose action
The Compose action takes the parsed JSON output and creates the object that you need to store in the blob.
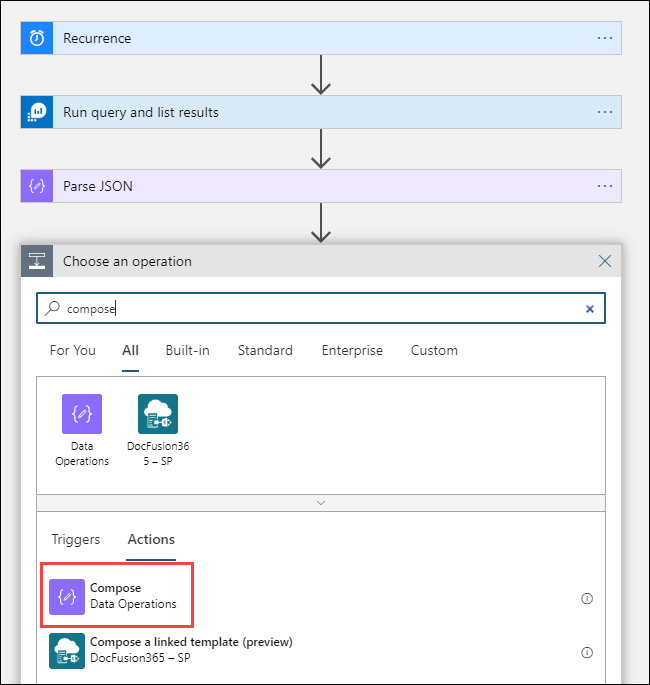
Select + New step, and then select + Add an action. Under Choose an operation, enter compose. Then select the Compose action.
Select the Inputs box to display a list of values from previous activities. Select Body from the Parse JSON action. This parsed output is from the log query.
Add the Create blob action
The Create blob action writes the composed JSON to storage.
Select + New step, and then select + Add an action. Under Choose an operation, enter blob. Then select the Create blob action.
Enter a name for the connection to your storage account in Connection Name. Then select the folder icon in the Folder path box to select the container in your storage account. Select Blob name to see a list of values from previous activities. Select Expression and enter an expression that matches your time interval. For this query, which is run hourly, the following expression sets the blob name per previous hour:
subtractFromTime(formatDateTime(utcNow(),'yyyy-MM-ddTHH:00:00'), 1,'Hour')Select the Blob content box to display a list of values from previous activities. Then select Outputs in the Compose section.
Test the workflow
To test the workflow, select Run. If the workflow has errors, they're indicated on the step with the problem. You can view the executions and drill in to each step to view the input and output to investigate failures. See Troubleshoot and diagnose workflow failures in Azure Logic Apps, if necessary.
View logs in storage
Go to the Storage accounts menu in the Azure portal and select your storage account. Select the Blobs tile. Then select the container you specified in the Create blob action. Select one of the blobs and then select Edit blob.
Logic App template
The optional Parse JSON step isn't included in template
{
    "definition": {
        "$schema": "https://schema.management.azure.com/providers/Microsoft.Logic/schemas/2016-06-01/workflowdefinition.json#",
        "actions": {
            "Compose": {
                "inputs": "@body('Run_query_and_list_results')",
                "runAfter": {
                    "Run_query_and_list_results": [
                        "Succeeded"
                    ]
                },
                "type": "Compose"
            },
            "Create_blob_(V2)": {
                "inputs": {
                    "body": "@outputs('Compose')",
                    "headers": {
                        "ReadFileMetadataFromServer": true
                    },
                    "host": {
                        "connection": {
                            "name": "@parameters('$connections')['azureblob']['connectionId']"
                        }
                    },
                    "method": "post",
                    "path": "/v2/datasets/@{encodeURIComponent(encodeURIComponent('AccountNameFromSettings'))}/files",
                    "queries": {
                        "folderPath": "/logicappexport",
                        "name": "@{utcNow()}",
                        "queryParametersSingleEncoded": true
                    }
                },
                "runAfter": {
                    "Compose": [
                        "Succeeded"
                    ]
                },
                "runtimeConfiguration": {
                    "contentTransfer": {
                        "transferMode": "Chunked"
                    }
                },
                "type": "ApiConnection"
            },
            "Run_query_and_list_results": {
                "inputs": {
                    "body": "let dt = now();\nlet year = datetime_part('year', dt);\nlet month = datetime_part('month', dt);\nlet day = datetime_part('day', dt);\n let hour = datetime_part('hour', dt);\nlet startTime = make_datetime(year,month,day,hour,0)-1h;\nlet endTime = startTime + 1h - 1tick;\nAzureActivity\n| where ingestion_time() between(startTime .. endTime)\n| project \n    TimeGenerated,\n    BlobTime = startTime, \n    OperationName ,\n    OperationNameValue ,\n    Level ,\n    ActivityStatus ,\n    ResourceGroup ,\n    SubscriptionId ,\n    Category ,\n    EventSubmissionTimestamp ,\n    ClientIpAddress = parse_json(HTTPRequest).clientIpAddress ,\n    ResourceId = _ResourceId ",
                    "host": {
                        "connection": {
                            "name": "@parameters('$connections')['azuremonitorlogs']['connectionId']"
                        }
                    },
                    "method": "post",
                    "path": "/queryData",
                    "queries": {
                        "resourcegroups": "resource-group-name",
                        "resourcename": "workspace-name",
                        "resourcetype": "Log Analytics Workspace",
                        "subscriptions": "workspace-subscription-id",
                        "timerange": "Set in query"
                    }
                },
                "runAfter": {},
                "type": "ApiConnection"
            }
        },
        "contentVersion": "1.0.0.0",
        "outputs": {},
        "parameters": {
            "$connections": {
                "defaultValue": {},
                "type": "Object"
            }
        },
        "triggers": {
            "Recurrence": {
                "evaluatedRecurrence": {
                    "frequency": "Day",
                    "interval": 1
                },
                "recurrence": {
                    "frequency": "Day",
                    "interval": 1
                },
                "type": "Recurrence"
            }
        }
    },
    "parameters": {
        "$connections": {
            "value": {
                "azureblob": {
                    "connectionId": "/subscriptions/logic-app-subscription-id/resourceGroups/logic-app-resource-group-name/providers/Microsoft.Web/connections/blob-connection-name",
                    "connectionName": "blob-connection-name",
                    "id": "/subscriptions/logic-app-subscription-id/providers/Microsoft.Web/locations/canadacentral/managedApis/azureblob"
                },
                "azuremonitorlogs": {
                    "connectionId": "/subscriptions/blob-connection-name/resourceGroups/logic-app-resource-group-name/providers/Microsoft.Web/connections/azure-monitor-logs-connection-name",
                    "connectionName": "azure-monitor-logs-connection-name",
                    "id": "/subscriptions/blob-connection-name/providers/Microsoft.Web/locations/canadacentral/managedApis/azuremonitorlogs"
                }
            }
        }
    }
}
Next steps
- Learn more about log queries in Azure Monitor.
- Learn more about Logic Apps.
- Learn more about Power Automate.


