On the Monitor menu in the Azure portal, select Data Collection Rules then select Create.
To create a DCR to collect platform metrics data, select the link on the top of the page.

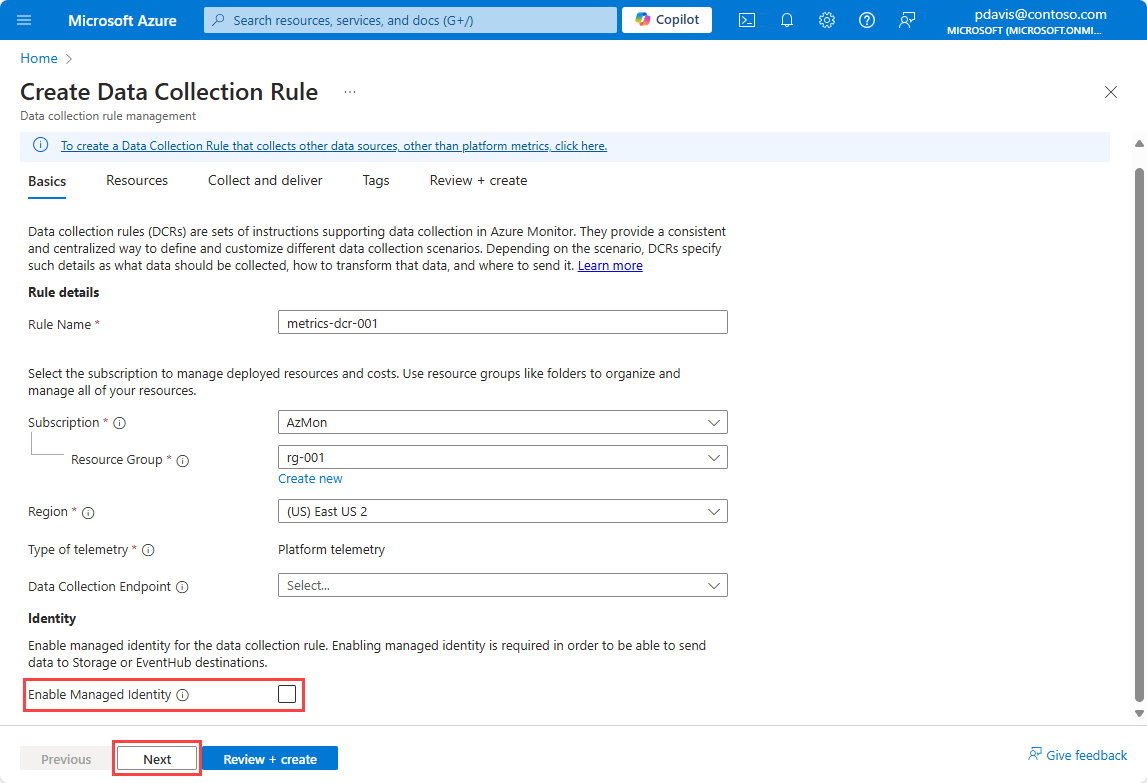
On the Create Data Collection Rule page, enter a rule name, select a Subscription, Resource group, and Region for the DCR.
Select Enable Managed Identity if you want to send metrics to a Storage Account or Event Hubs.
Select Next

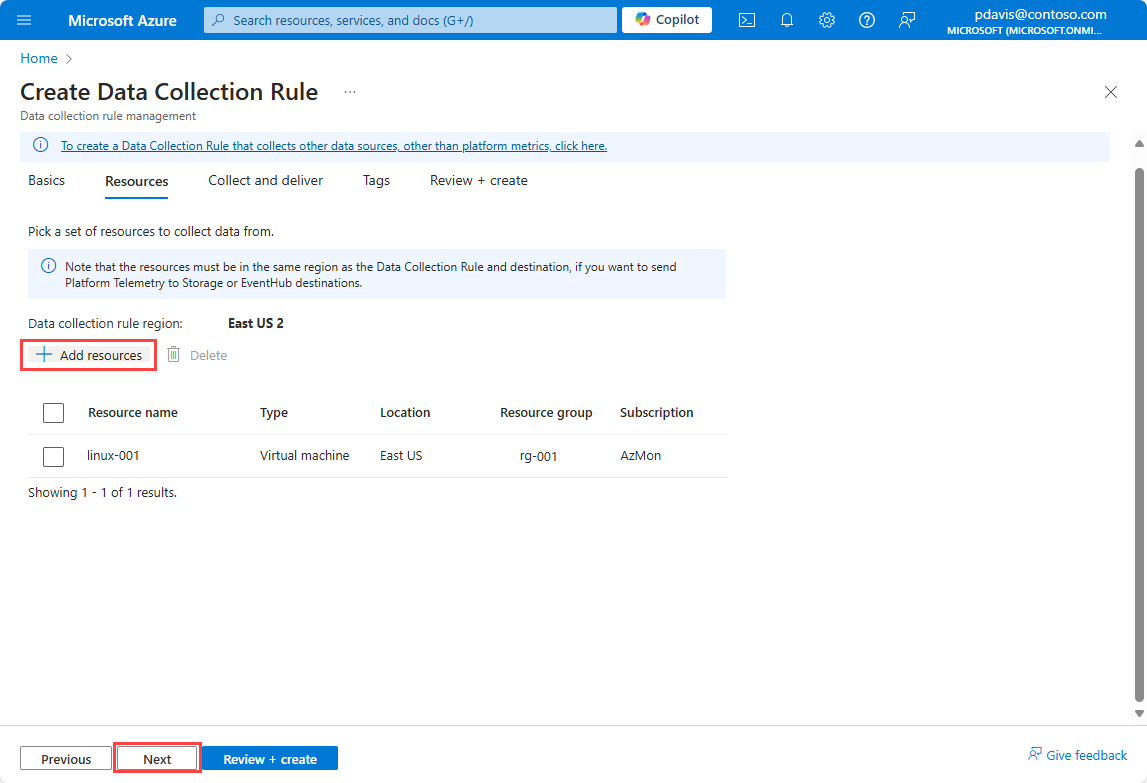
On the Resources page, select Add resources to add the resources you want to collect metrics from.
Select Next to move to the Collect and deliver tab.

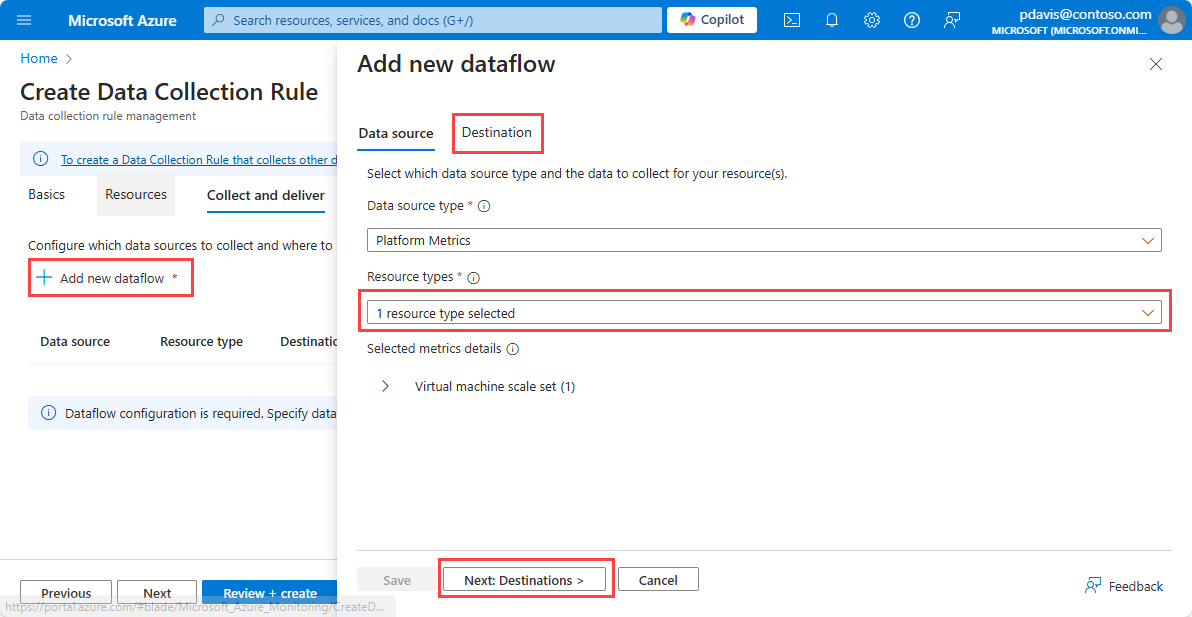
Select Add new dataflow
The resource type of the resource that chose in the previous step is automatically selected. Add more resource types if you want to use this rule to collect metrics from multiple resource types in the future.
Select Next Destinations to move to the Destinations tab.

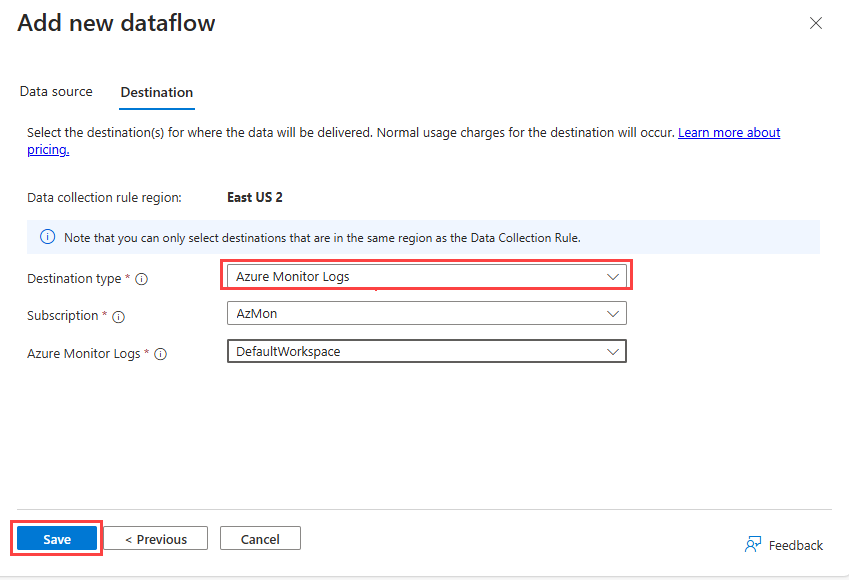
To send metrics to a Log Analytics workspace, select Azure Monitor Logs from the Destination type dropdown.
- Select the Subscription and the Log Analytics workspace you want to send the metrics to.
To send metrics to Event Hubs, select Event Hub from the Destination type dropdown.
- Select the Subscription, the Event Hub namespace, and the Event Hub instance name.
To send metrics to a Storage Account, select Storage Account from the Destination type dropdown.
- Select the Subscription, the Storage Account, and the Blob container where you want to store the metrics.
Note
To sent metrics to a Storage Account or Event Hubs, the resource generating the metrics, the DCR, and the Storage Account or Event Hub, must all be in the same region.
To send metrics to a Log Analytics workspace, the DCR must be in the same region as the Log Analytics workspace. The resource generating the metrics can be in any region.
To select Storage Account or Event Hubs as the destination, you must enable managed identity for the DCR on the Basics tab.
Select Save , then select Review + create.

Create a JSON file containing the collection rule specification. For more information, see DCR specifications. For sample JSON files, see Sample Metrics Export JSON objects.
Important
The rule file has the same format as used for PowerShell and the REST API, however the file must not contain identity, the location, or kind. These parameters are specified in the az monitor data-collection rule create command.
Use the following command to create a data collection rule for metrics using the Azure CLI.
az monitor data-collection rule create
        --name
        --resource-group
        --location
        --kind PlatformTelemetry
        --rule-file
        [--identity "{type:'SystemAssigned'}" ]
For storage account and Event Hubs destinations, you must enable managed identity for the DCR using --identity "{type:'SystemAssigned'}". Identity isn't required for Log Analytics workspaces.
For example,
 az monitor data-collection rule create
    --name cli-dcr-001
    --resource-group rg-001
    --location centralus
    --kind PlatformTelemetry
    --identity "{type:'SystemAssigned'}"
    --rule-file cli-dcr.json
Copy the id and the principalId of the DCR to use in assigning the role to create an association between the DCR and a resource.
  "id": "/subscriptions/bbbb1b1b-cc2c-dd3d-ee4e-ffffff5f5f5f/resourceGroups/rg-001/providers/Microsoft.Insights/dataCollectionRules/cli-dcr-001",
  "identity": {
    "principalId": "eeeeeeee-ffff-aaaa-5555-666666666666",
    "tenantId": "aaaabbbb-0000-cccc-1111-dddd2222eeee",
    "type": "systemAssigned"
  },
Grant write permissions to the managed entity
The managed identity used by the DCR must have write permissions to the destination when the destination is a Storage Account or Event Hubs.
To grant permissions for the rule's managed entity, assign the appropriate role to the entity.
The following table shows the roles required for each destination type:
| Destination type |
Role |
| Log Analytics workspace |
not required |
| Azure storage account |
Storage Blob Data Contributor |
| Event Hubs |
Azure Event Hubs Data Sender |
For more information on assigning roles, see Assign Azure roles to a managed identity.
To assign a role to a managed identity using CLI, use az role assignment create. For more information, see Role Assignments - Create
Assign the appropriate role to the managed identity of the DCR.
az role assignment create --assignee <system assigned principal ID> \
                          --role <`Storage Blob Data Contributor` or `Azure Event Hubs Data Sender`  \
                          --scope <storage account ID or eventhub ID>
The following example assigns the Storage Blob Data Contributor role to the managed identity of the DCR for a storage account.
az role assignment create --assignee eeeeeeee-ffff-aaaa-5555-666666666666 \
    --role "Storage Blob Data Contributor" \
    --scope /subscriptions/bbbb1b1b-cc2c-DD3D-ee4e-ffffff5f5f5f/resourceGroups/ed-rg-DCRTest/providers/Microsoft.Storage/storageAccounts/metricsexport001
Create a data collection rule association
After you create the data collection rule, create a data collection rule association (DCRA) to associate the rule with the resource to be monitored. For more information, see Data Collection Rule Associations - Create
Use az monitor data-collection rule association create to create an association between a data collection rule and a resource.
az monitor data-collection rule association create --name
                                                  --rule-id
                                                  --resource
The following example creates an association between a data collection rule and a Key Vault.
az monitor data-collection rule association create --name "keyValut-001" \
    --rule-id "/subscriptions/bbbb1b1b-cc2c-DD3D-ee4e-ffffff5f5f5f/resourceGroups/rg-dcr/providers/Microsoft.Insights/dataCollectionRules/dcr-cli-001" \
    --resource "/subscriptions/bbbb1b1b-cc2c-DD3D-ee4e-ffffff5f5f5f/resourceGroups/rg-dcr/providers/Microsoft.KeyVault/vaults/keyVault-001"
Create a JSON file containing the collection rule specification. For more information, see DCR specifications. For sample JSON files, see Sample Metrics Export JSON objects.
Use the New-AzDataCollectionRule command to create a data collection rule for metrics using PowerShell. For more information, see New-AzDataCollectionRule.
New-AzDataCollectionRule -Name
                         -ResourceGroupName
                         -JsonFilePath
For example,
New-AzDataCollectionRule -Name dcr-powershell-hub -ResourceGroupName rg-001 -JsonFilePath dcr-storage-account.json
Copy the id and the IdentityPrincipalId of the DCR to use in assigning the role to create an association between the DCR and a resource.resource.
Id                                        : /subscriptions/bbbb1b1b-cc2c-DD3D-ee4e-ffffff5f5f5f/resourceGroups/rg-001/providers/Microsoft.Insights/dataCollectionRules/dcr-powershell-hub
IdentityPrincipalId                       : eeeeeeee-ffff-aaaa-5555-666666666666
IdentityTenantId                          : 0000aaaa-11bb-cccc-dd22-eeeeee333333
IdentityType                              : systemAssigned
IdentityUserAssignedIdentity              : {
                                            }
Grant write permissions to the managed entity
The managed identity used by the DCR must have write permissions to the destination when the destination is a Storage Account or Event Hubs.
To grant permissions for the rule's managed entity, assign the appropriate role to the entity.
The following table shows the roles required for each destination type:
| Destination type |
Role |
| Log Analytics workspace |
not required |
| Azure storage account |
Storage Blob Data Contributor |
| Event Hubs |
Azure Event Hubs Data Sender |
For more information, see Assign Azure roles to a managed identity.
To assign a role to a managed identity using PowerShell, see New-AzRoleAssignment
Assign the appropriate role to the managed identity of the DCR using New-AzRoleAssignment.
New-AzRoleAssignment -ObjectId <objectId> -RoleDefinitionName <roleName> -Scope /subscriptions/<subscriptionId>/resourcegroups/<resourceGroupName>/providers/<providerName>/<resourceType>/<resourceSubType>/<resourceName>
The following example assigns the Azure Event Hubs Data Sender role to the managed identity of the DCR at the subscription level.
New-AzRoleAssignment -ObjectId eeeeeeee-ffff-aaaa-5555-666666666666 -RoleDefinitionName "Azure Event Hubs Data Sender" -Scope /subscriptions/bbbb1b1b-cc2c-DD3D-ee4e-ffffff5f5f5f
Create a data collection rule association
After you create the data collection rule, create a data collection rule association (DCRA) to associate the rule with the resource to be monitored. Use New-AzDataCollectionRuleAssociation to create an association between a data collection rule and a resource. For more information, see New-AzDataCollectionRuleAssociation
New-AzDataCollectionRuleAssociation
   -AssociationName <String>
   -ResourceUri <String>
   -DataCollectionRuleId <String>
The following example creates an association between a data collection rule and a Key Vault.
New-AzDataCollectionRuleAssociation
        -AssociationName keyVault-001-association
        -ResourceUri /subscriptions/bbbb1b1b-cc2c-DD3D-ee4e-ffffff5f5f5f/resourceGroups/rg-dcr/providers/Microsoft.KeyVault/vaults/keyVault-001
        -DataCollectionRuleId /subscriptions/bbbb1b1b-cc2c-DD3D-ee4e-ffffff5f5f5f/resourceGroups/rg-dcr/providers/Microsoft.Insights/dataCollectionRules/vaultsDCR001
Create a data collection rule using the REST API
Creating a data collection rule for metrics requires the following steps:
- Create the data collection rule.
- Grant permissions for the rule's managed entity to write to the destination
- Create a data collection rule association.
Create the data collection rule
To create a DCR using the REST API, you must make an authenticated request using a bearer token. For more information on authenticating with Azure Monitor, see Authenticate Azure Monitor requests.
Use the following endpoint to create a data collection rule for metrics using the REST API.
For more information, see Data Collection Rules - Create.
PUT https://management.azure.com/subscriptions/{subscriptionId}/resourceGroups/{resourceGroupName}/providers/Microsoft.Insights/dataCollectionRules/{dataCollectionRuleName}?api-version=2023-03-11
For example
https://management.azure.com/subscriptions/aaaa0a0a-bb1b-cc2c-dd3d-eeeeee4e4e4e/resourceGroups/rg-001/providers/Microsoft.Insights/dataCollectionRules/dcr-001?api-version=2023-03-11
The payload is a JSON object that defines a collection rule. The payload is sent in the body of the request. For more information on the JSON structure, see DCR specifications. For sample DCR JSON objects, see Sample Metrics Export JSON objects
Grant write permissions to the managed entity
The managed identity used by the DCR must have write permissions to the destination when the destination is a Storage Account or Event Hubs.
To grant permissions for the rule's managed entity, assign the appropriate role to the entity.
The following table shows the roles required for each destination type:
| Destination type |
Role |
| Log Analytics workspace |
not required |
| Azure storage account |
Storage Blob Data Contributor |
| Event Hubs |
Azure Event Hubs Data Sender |
For more information, see Assign Azure roles to a managed identity.
To assign a role to a managed identity using REST, see Role Assignments - Create
Create a data collection rule association
After you create the data collection rule, create a data collection rule association (DCRA) to associate the rule with the resource to be monitored. For more information, see Data Collection Rule Associations - Create
To create a DCRA using the REST API, use the following endpoint and payload:
PUT https://management.azure.com/{resourceUri}/providers/Microsoft.Insights/dataCollectionRuleAssociations/{associationName}?api-version=2022-06-0
Body:
{
        "properties":
        {
          "description": "<DCRA description>",
          "dataCollectionRuleId": "/subscriptions/{subscriptionId}/resourceGroups/{resource group name}/providers/Microsoft.Insights/dataCollectionRules/{DCR name}"
        }
}
For example,
https://management.azure.com//subscriptions/aaaa0a0a-bb1b-cc2c-dd3d-eeeeee4e4e4e/resourcegroups/rg-001/providers/Microsoft.Compute/virtualMachines/vm002/providers/Microsoft.Insights/dataCollectionRuleAssociations/dcr-la-ws-vm002?api-version=2023-03-11

{
        "properties":
        {
          "description": "Association of platform telemetry DCR with VM vm002",
          "dataCollectionRuleId": "/subscriptions/aaaa0a0a-bb1b-cc2c-dd3d-eeeeee4e4e4e/resourceGroups/rg-001/providers/Microsoft.Insights/dataCollectionRules/dcr-la-ws"
        }
}
Use the following template to create a DCR. For more information, see Microsoft.Insights dataCollectionRules
Template file
{
    "$schema": "https://schema.management.azure.com/schemas/2019-04-01/deploymentTemplate.json#",
    "contentVersion": "1.0.0.0",
    "parameters": {
        "dataCollectionRuleName": {
            "type": "string",
            "metadata": {
                "description": "Specifies the name of the Data Collection Rule to create."
            }
        },
        "location": {
            "type": "string",
            "metadata": {
                "description": "Specifies the location in which to create the Data Collection Rule."
            }
        }
    },
    "resources": [
        {
            "type": "Microsoft.Insights/dataCollectionRules",
            "name": "[parameters('dataCollectionRuleName')]",
            "kind": "PlatformTelemetry",
              "identity": {
                 "type": "userassigned" | "systemAssigned",
                 "userAssignedIdentities": {
		        			 "type": "string"
                   }
                 },
            "location": "[parameters('location')]",
            "apiVersion": "2023-03-11",
            "properties": {
                "dataSources": {
                    "platformTelemetry": [
                        {
                            "streams": [
                                 "<resourcetype>:<metric name> | Metrics-Group-All"
                            ],
                            "name": "myPlatformTelemetryDataSource"
                        }
                    ]
                },
                "destinations": {
                    "logAnalytics": [
                        {
                            "workspaceResourceId": "[parameters('workspaceId')]",
                            "name": "myDestination"
                        }
                    ]
                },
                "dataFlows": [
                    {
                        "streams": [
                            "<resourcetype>:<metric name> | Metrics-Group-All"
                        ],
                        "destinations": [
                            "myDestination"
                        ]
                    }
                ]
            }
        }
    ]
}
Parameters file
{
    "$schema": "https://schema.management.azure.com/schemas/2015-01-01/deploymentParameters.json#",
    "contentVersion": "1.0.0.0",
    "parameters": {
        "dataCollectionRuleName": {
            "value": "metrics-dcr-001"
        },
        "workspaceId": {
            "value": "/subscriptions/aaaa0a0a-bb1b-cc2c-dd3d-eeeeee4e4e4e/resourceGroups/azuremonitorworkspaceinsights/providers/microsoft.operationalinsights/workspaces/amw-insight-ws"
        },
        "location": {
            "value": "eastus"
        }
    }
}
Sample DCR template:
{
    "$schema": "https://schema.management.azure.com/schemas/2019-04-01/deploymentTemplate.json#",
    "contentVersion": "1.0.0.0",
    "resources": [
        {
            "type": "Microsoft.Insights/dataCollectionRules",
            "apiVersion": "2023-03-11",
            "name": "[parameters('dataCollectionRuleName')]",
            "location": "[parameters('location')]",
            "kind": "PlatformTelemetry",
            "identity": {
                "type": "SystemAssigned"
            },
            "properties": {
                "dataSources": {
                    "platformTelemetry": [
                        {
                            "streams": [
                                "Microsoft.Compute/virtualMachines:Metrics-Group-All",
                                "Microsoft.Compute/virtualMachineScaleSets:Metrics-Group-All",
                                "Microsoft.Cache/redis:Metrics-Group-All",
                                "Microsoft.keyvault/vaults:Metrics-Group-All"
                            ],
                            "name": "myPlatformTelemetryDataSource"
                        }
                    ]
                },
                "destinations": {
                    "logAnalytics": [
                        {
                            "workspaceResourceId": "[parameters('workspaceId')]",
                            "name": "myDestination"
                        }
                    ]
                },
                "dataFlows": [
                    {
                        "streams": [
                            "Microsoft.Compute/virtualMachines:Metrics-Group-All",
                            "Microsoft.Compute/virtualMachineScaleSets:Metrics-Group-All",
                            "Microsoft.Cache/redis:Metrics-Group-All",
                            "Microsoft.keyvault/vaults:Metrics-Group-All"
                        ],
                        "destinations": [
                            "myDestination"
                        ]
                    }
                ]
            }
        }
    ]
}
After creating the DCR and DCRA, allow up to 30 minutes for the first platform metrics data to appear in the Log Analytics Workspace. Once data starts flowing, the latency for a platform metric time series flowing to a Log Analytics workspace, Storage Account, or Event Hubs is approximately 3 minutes, depending on the resource type.
Once you install the DCR, it may take several minutes for the changes to take effect and data to be collected with the updated DCR. If you don't see any data being collected, it can be difficult to determine the root cause of the issue. Use the DCR monitoring features, which include metrics and logs to help troubleshoots.
If you don't see data being collected, follow these basic steps to troubleshoot the issue.

