Live metrics: Monitor and diagnose with 1-second latency
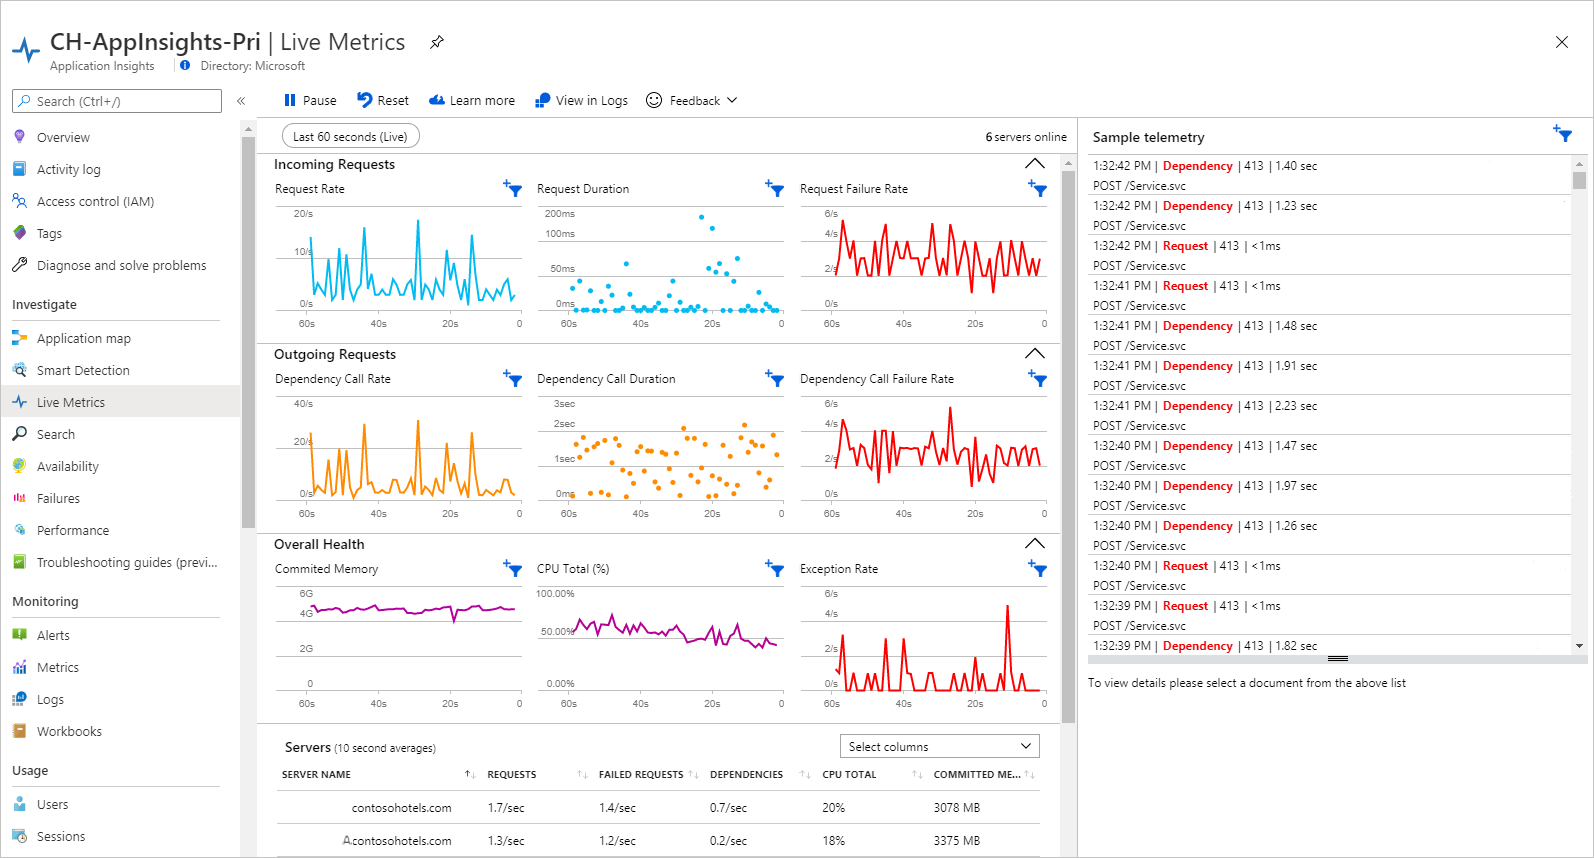
Use live metrics from Application Insights to monitor web applications. Select and filter metrics and performance counters to watch in real time and inspect stack traces from sample failed requests and exceptions. The live metrics experience is a powerful diagnostic tool when combined with .NET Profiler and Snapshot Debugger.
With live metrics, you can:
- Validate a fix while it's released by watching performance and failure counts.
- Watch the effect of test loads and diagnose issues live.
- Focus on particular test sessions or filter out known issues by selecting and filtering the metrics you want to watch.
- Get exception traces as they happen.
- Experiment with filters to find the most relevant KPIs.
- Monitor any Windows performance counter live.
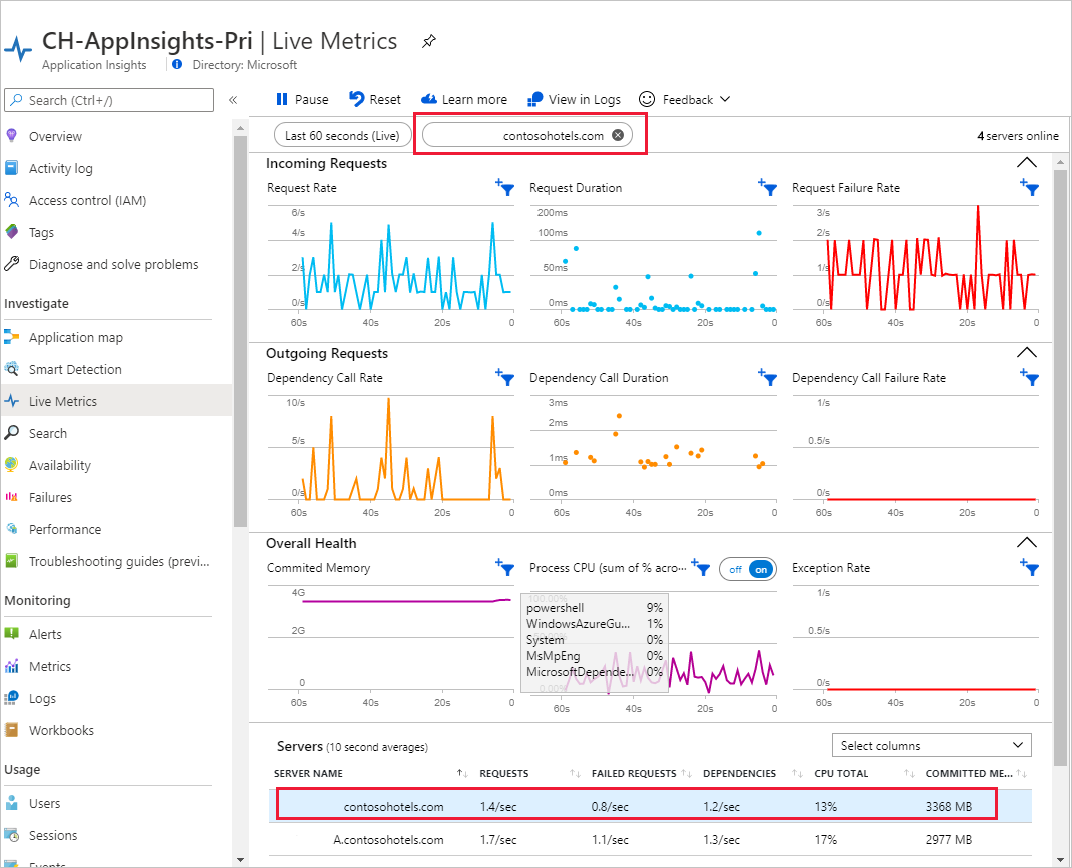
- Easily identify a server that's having issues and filter all the KPI/live feed to just that server.
Get started
- Enable live metrics by following language-specific guidelines:
- ASP.NET: Not supported.
- ASP.NET Core: Enabled by default.
- Java: Enabled by default.
- Node.js: Enabled by default.
- Python: Pass
enable_live_metrics=Trueintoconfigure_azure_monitor. See the Azure Monitor OpenTelemetry Distro documentation for more information.
Open the Application Insights resource for your application in the Azure portal. Select Live metrics, which is listed under Investigate in the left hand menu.
Secure the control channel by enabling Microsoft Entra authentication if you use custom filters.
Note
On March 31, 2025, support for instrumentation key ingestion will end. Instrumentation key ingestion will continue to work, but we'll no longer provide updates or support for the feature. Transition to connection strings to take advantage of new capabilities.
How do live metrics differ from metrics explorer and Log Analytics?
| Capabilities | Live Stream | Metrics explorer and Log Analytics |
|---|---|---|
| Latency | Data displayed within one second. | Aggregated over minutes. |
| No retention | Data persists while it's on the chart and is then discarded. | Data retained for 90 days. |
| On demand | Data is only streamed while the live metrics pane is open. | Data is sent whenever the SDK is installed and enabled. |
| Free | There's no charge for Live Stream data. | Subject to pricing. |
| Sampling | All selected metrics and counters are transmitted. Failures and stack traces are sampled. | Events can be sampled. |
| Control channel | Filter control signals are sent to the SDK. We recommend you secure this channel. | Communication is one way, to the portal. |
Select and filter your metrics
These capabilities are available with ASP.NET, ASP.NET Core, and Azure Functions (v2).
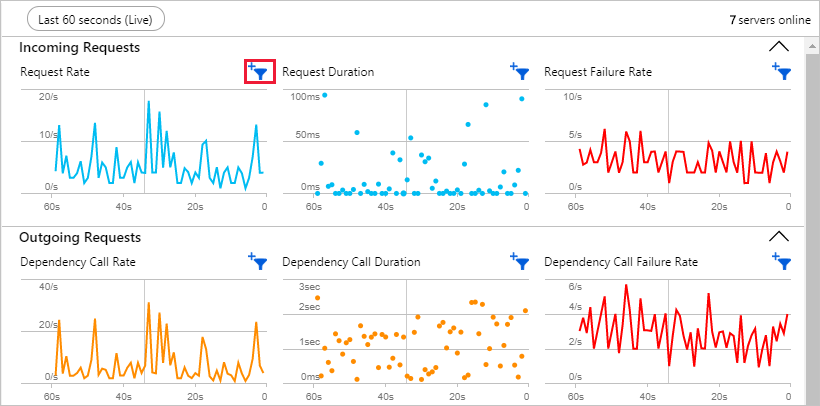
You can monitor custom performance indicators live by applying arbitrary filters on any Application Insights telemetry from the portal. Select the filter control that shows when you mouse-over any of the charts. The following chart plots a custom Request count KPI with filters on URL and Duration attributes. Validate your filters with the stream preview section that shows a live feed of telemetry that matches the criteria you've specified at any point in time.
You can monitor a value different from Count. The options depend on the type of stream, which could be any Application Insights telemetry like requests, dependencies, exceptions, traces, events, or metrics. It can also be your own custom measurement.
Along with Application Insights telemetry, you can also monitor any Windows performance counter. Select it from the stream options and provide the name of the performance counter.
Live metrics are aggregated at two points: locally on each server and then across all servers. You can change the default at either one by selecting other options in the respective dropdown lists.
Sample telemetry: custom live diagnostic events
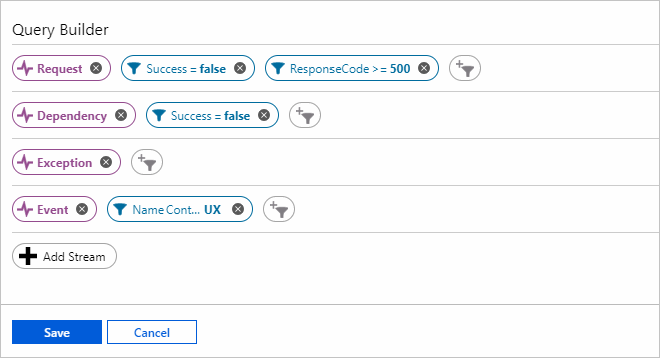
By default, the live feed of events shows samples of failed requests and dependency calls, exceptions, events, and traces. Select the filter icon to see the applied criteria at any point in time.
As with metrics, you can specify any arbitrary criteria to any of the Application Insights telemetry types. In this example, we're selecting specific request failures and events.
Note
Currently, for exception message-based criteria, use the outermost exception message. In the preceding example, to filter out the benign exception with an inner exception message (follows the "<--" delimiter) "The client disconnected," use a message not-contains "Error reading request content" criteria.
To see the details of an item in the live feed, select it. You can pause the feed either by selecting Pause or by scrolling down and selecting an item. Live feed resumes after you scroll back to the top, or when you select the counter of items collected while it was paused.
Filter by server instance
If you want to monitor a particular server role instance, you can filter by server. To filter, select the server name under Servers.
Secure the control channel
Secure the live metrics control channel by enabling Microsoft Entra authentication, which prevents unauthorized disclosure of potentially sensitive information entered into custom filters.
Note
On September 30, 2025, API keys used to stream live metrics telemetry into Application Insights will be retired. After that date, applications that use API keys won't be able to send live metrics data to your Application Insights resource. Authenticated telemetry ingestion for live metrics streaming to Application Insights will need to be done with Microsoft Entra authentication for Application Insights.
Supported features table
| Language | Basic metrics | Performance metrics | Custom filtering | Sample telemetry | CPU split by process |
|---|---|---|---|---|---|
| .NET Framework | Supported (LTS) | Supported (LTS) | Supported (LTS) | Supported (LTS) | Supported (LTS) |
| .NET Core (target=.NET Framework) | Supported (LTS) | Supported (LTS) | Supported (LTS) | Supported (LTS) | Supported (LTS) |
| .NET Core (target=.NET Core) | Supported (LTS) | Supported* | Supported (LTS) | Supported (LTS) | Not supported |
| Azure Functions v2 | Supported | Supported | Supported | Supported | Not supported |
| Java | Supported (V2.0.0+) | Supported (V2.0.0+) | Not supported | Supported (V3.2.0+) | Not supported |
| Node.js | Supported (V1.3.0+) | Supported (V1.3.0+) | Not supported | Supported (V1.3.0+) | Not supported |
| Python | Supported (Distro Version 1.6.0+) | Not supported | Not supported | Not supported | Not supported |
Basic metrics include request, dependency, and exception rate. Performance metrics (performance counters) include memory and CPU. Sample telemetry shows a stream of detailed information for failed requests and dependencies, exceptions, events, and traces.
PerfCounters support varies slightly across versions of .NET Core that don't target the .NET Framework:
- PerfCounters metrics are supported when running in Azure App Service for Windows (ASP.NET Core SDK version 2.4.1 or higher).
- PerfCounters are supported when the app is running on any Windows machine for apps that target .NET Core LTS or higher.
- PerfCounters are supported when the app is running anywhere (such as Linux, Windows, app service for Linux, or containers) in the latest versions, but only for apps that target .NET Core LTS or higher.
Troubleshooting
The following section discusses common troubleshooting scenarios for the live metrics experience.
Missing live metrics data
The live metrics experience uses different IP addresses than other Application Insights telemetry. Make sure those IP addresses are open in your firewall. Also check that outgoing ports for live metrics are open in the firewall of your servers.
As described in the Azure TLS 1.2 migration announcement, live metrics now only support TLS 1.2. If you're using an older version of TLS, the live metrics pane doesn't display any data. For applications based on .NET Framework 4.5.1, see Enable Transport Layer Security (TLS) 1.2 on clients - Configuration Manager to support the newer TLS version.
Validate Application Insights is enabled and your app is using a recent version of the Azure Monitor OpenTelemetry Distro. If you're using the.NET Classic API, install the Application Insights NuGet package.
Authorize connected servers: This option will not be available
We strongly discourage the use of unsecured channels.
If you choose to try custom filters without setting up an authenticated channel, you'll have to authorize connected servers in every new session or when new servers come online. Further, the use of unsecured channels will be automatically disabled after six months.
A dialog will display a warning, "You can stream metrics and events with custom filters, which are sent back to your app. Avoid entering potentially sensitive information (such as customer ID), until you set up an authenticated channel. However, if you recognize and trust all servers below, you can try custom filters without authentication. This option will not be available after ##/##/####. Servers connected without authentication:"
To fix this warning, see Secure the control channel.
Low number of monitored server instances
The number of monitored server instances displayed by live metrics might be lower than the actual number of instances allocated for the application. This mismatch is because many modern web servers unload applications that don't receive requests over a period of time to conserve resources. Because live metrics only count servers that are currently running the application, servers that have already unloaded the process won't be included in that total.
Missing configuration for .NET
Verify that you're using the latest version of the NuGet package Microsoft.ApplicationInsights.PerfCounterCollector.
Edit the
ApplicationInsights.configfile:- Verify that the connection string points to the Application Insights resource you're using.
- Locate the
QuickPulseTelemetryModuleconfiguration option. If it isn't there, add it. - Locate the
QuickPulseTelemetryProcessorconfiguration option. If it isn't there, add it.
<TelemetryModules>
<Add Type="Microsoft.ApplicationInsights.Extensibility.PerfCounterCollector.
QuickPulse.QuickPulseTelemetryModule, Microsoft.AI.PerfCounterCollector"/>
</TelemetryModules>

<TelemetryProcessors>
<Add Type="Microsoft.ApplicationInsights.Extensibility.PerfCounterCollector.
QuickPulse.QuickPulseTelemetryProcessor, Microsoft.AI.PerfCounterCollector"/>
</TelemetryProcessors>
Restart the application.
"Data is temporarily inaccessible" status message
When navigating to live metrics, you can see a banner with the status message: "Data is temporarily inaccessible. The updates on our status are posted here https://aka.ms/aistatus "
Follow the link to the Azure status page and check if there's an activate outage affecting Application Insights. Verify that firewalls and browser extensions aren't blocking access to live metrics if an outage isn't occurring. For example, some popular ad-blocker extensions block connections to *.monitor.azure.com. In order to use the full capabilities of live metrics, either disable the ad-blocker extension or add an exclusion rule for the domain *.livediagnostics.monitor.azure.com to your ad-blocker, firewall, etc.
Unexpected large number of requests to livediagnostics.monitor.azure.com
Application Insights SDKs use a REST API to communicate with QuickPulse endpoints, which provide live metrics for your web application. By default, the SDKs poll the endpoints once every five seconds to check if you're viewing the live metrics pane in the Azure portal.
If you open live metrics, the SDKs switch to a higher frequency mode and send new metrics to QuickPulse every second. This allows you to monitor and diagnose your live application with 1-second latency, but also generates more network traffic. To restore normal flow of traffic, naviage away from the live metrics pane.
Note
The REST API calls made by the SDKs to QuickPulse endpoints are not tracked by Application Insights and do not affect your dependency calls or other metrics. However, you may see them in other network monitoring tools.


