Failures and Performance views
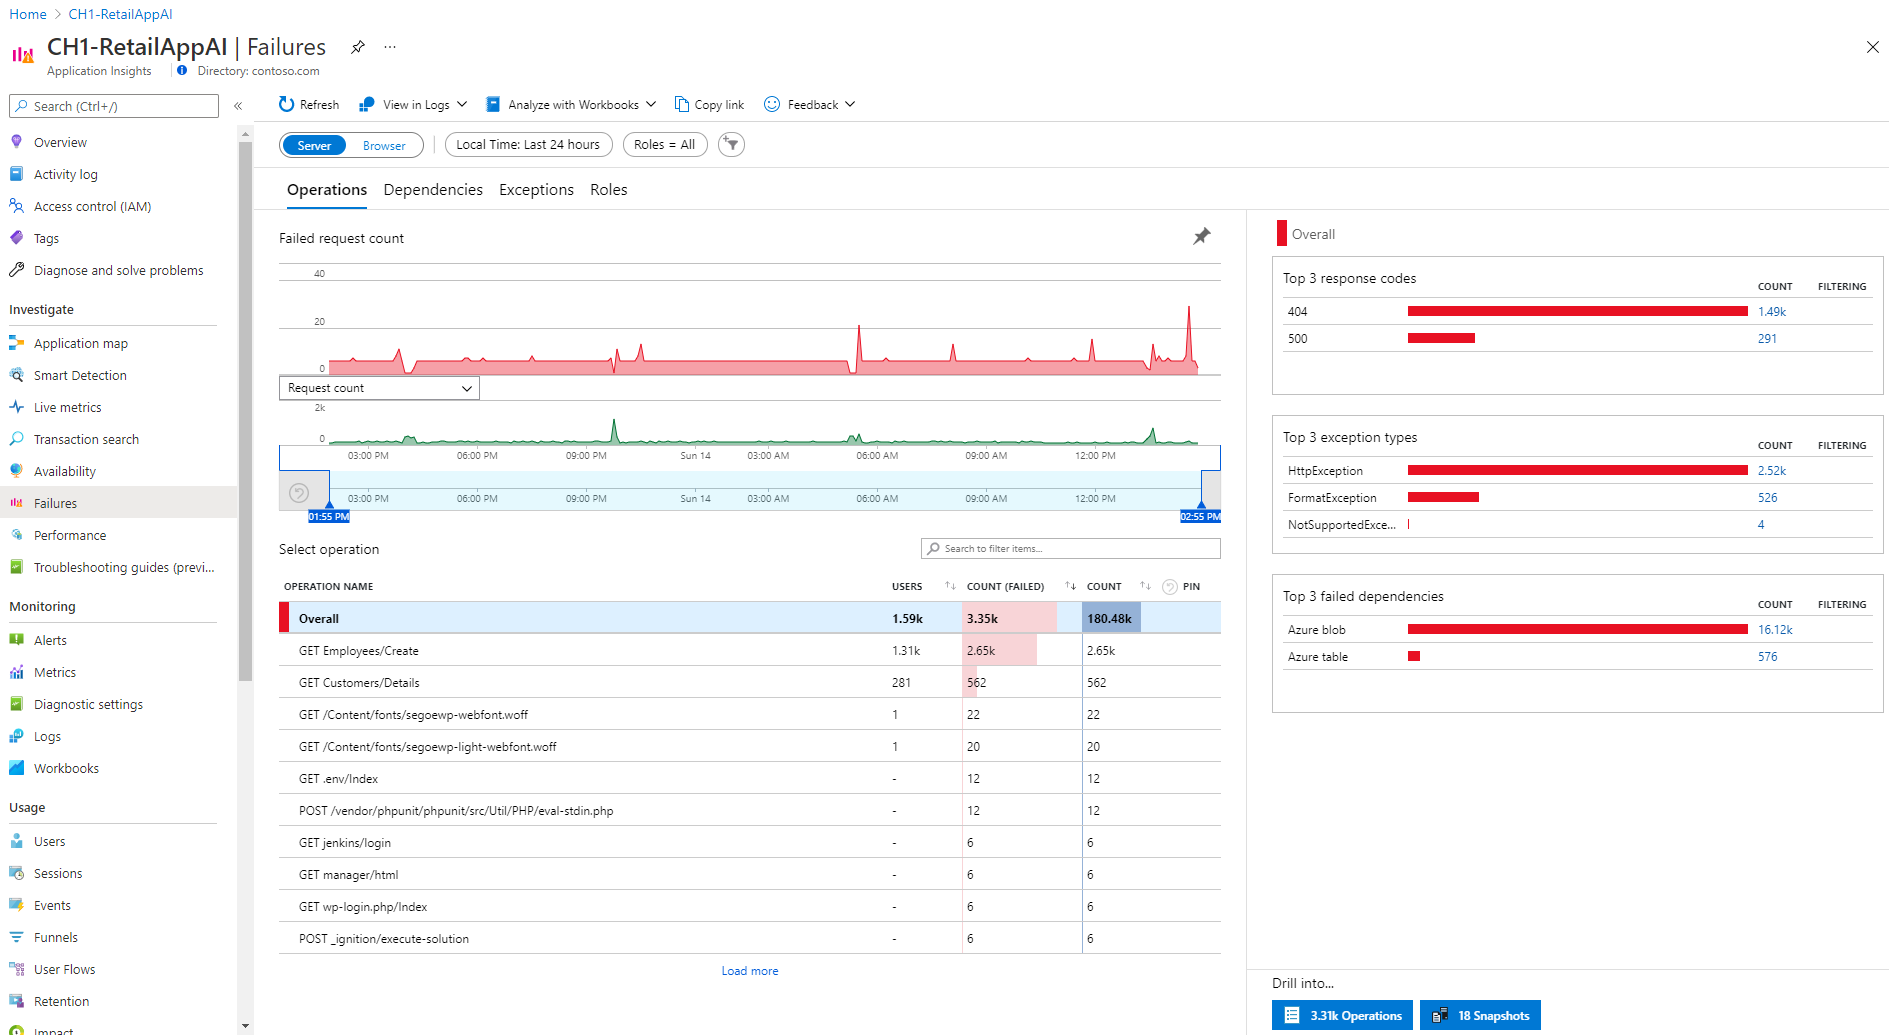
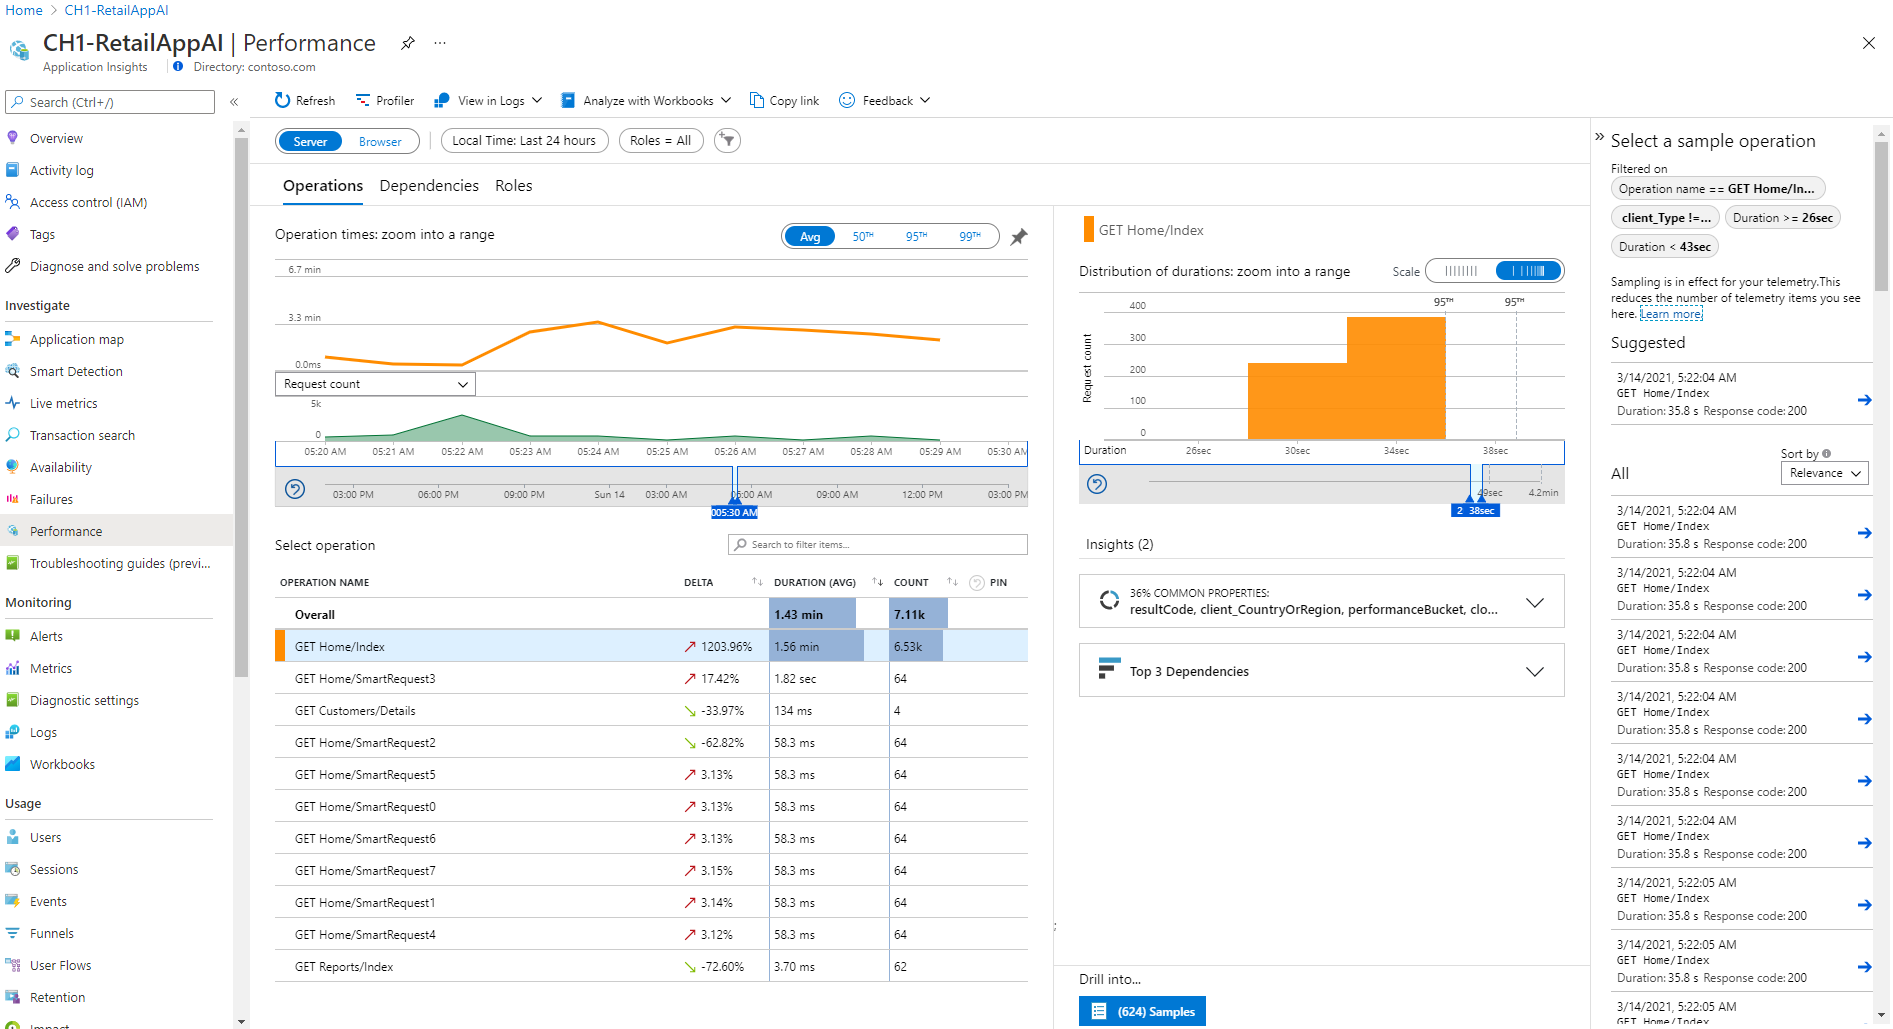
Application Insights features two key tools: the Failures view and the Performance view. The Failures view tracks errors, exceptions, and faults, offering clear insights for fast problem-solving and enhanced stability. The Performance view quickly identifies and helps resolve application bottlenecks by displaying response times and operation counts. Together, they ensure the ongoing health and efficiency of web applications.
Application Insights comes with a curated Application Performance Management (APM) experience to help you diagnose failures in your monitored applications. Select the Failures option in the Application Insights resource menu on the left, under Investigate, to get a list of all failures collected for your application and drill into each one.
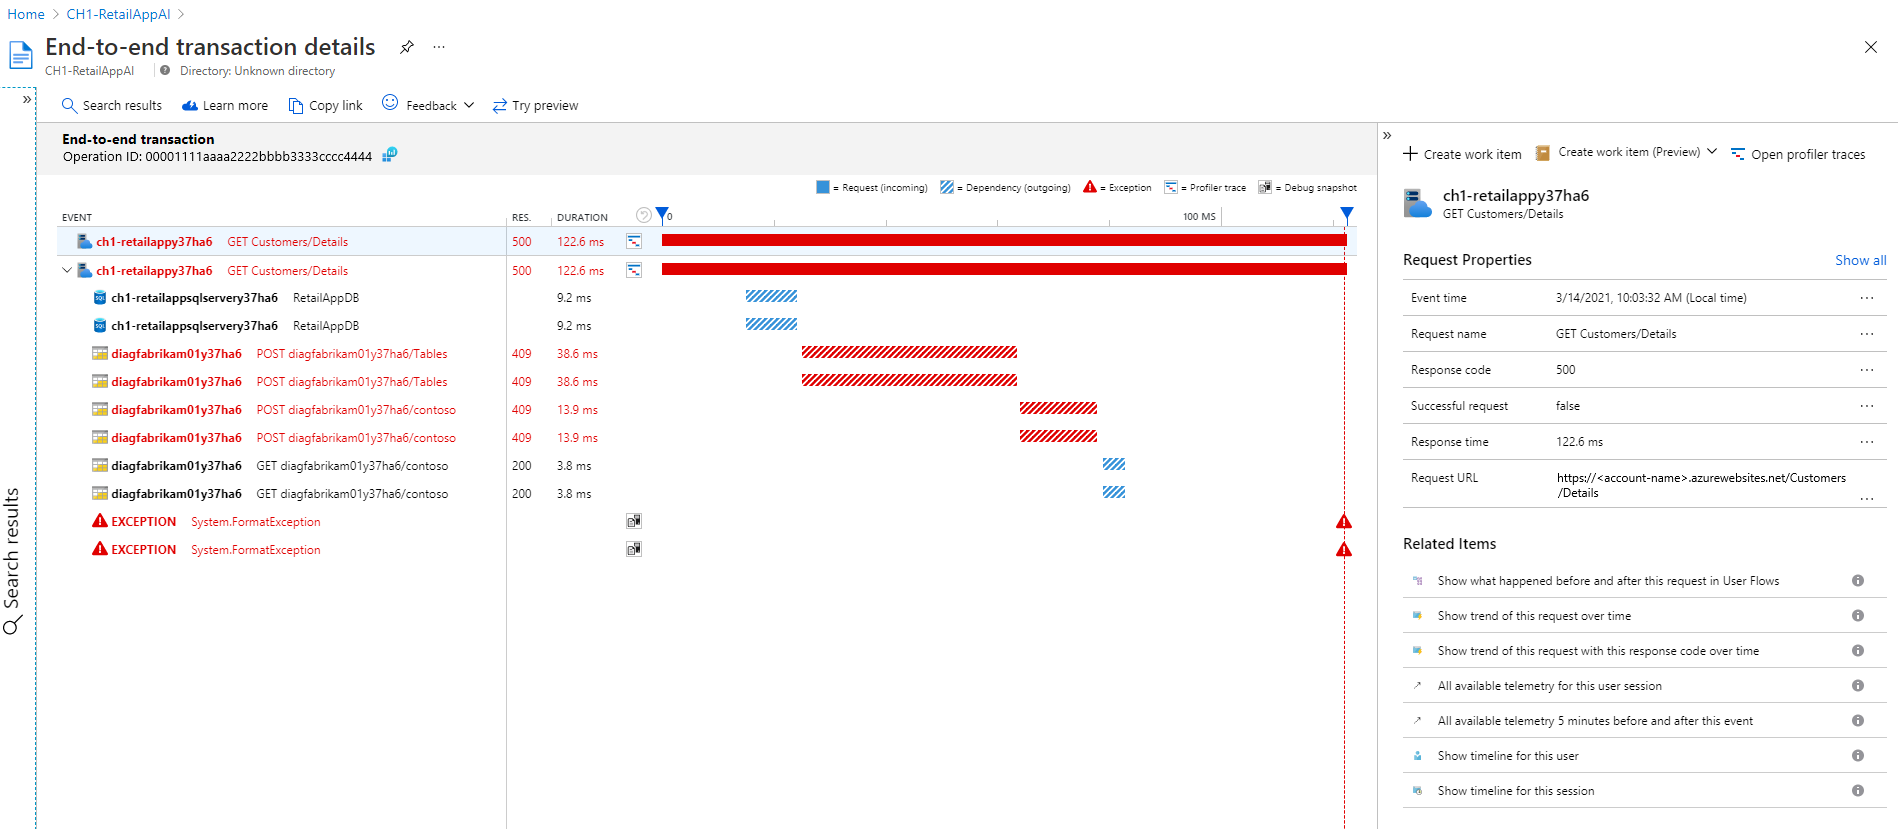
To continue your investigation into the root cause of the error or exception, you can drill into the problematic transaction for a detailed end-to-end transaction view that includes dependencies and exception details.
You can also diagnose failures in your application or its components from the application map, by selecting Investigate failures from the triage pane of Application Map.
Next steps
- Learn more about using Application Map to spot performance bottlenecks and failure hotspots across all components of your application.
- Learn more about using the Availability view to set up recurring tests to monitor availability and responsiveness for your application.


