EventCounters introduction
EventCounter is .NET/.NET Core mechanism to publish and consume counters or statistics. EventCounters are supported in all OS platforms - Windows, Linux, and macOS. It can be thought of as a cross-platform equivalent for the PerformanceCounters that is only supported in Windows systems.
While users can publish any custom EventCounters to meet their needs, .NET publishes a set of these counters by default. This document walks through the steps required to collect and view EventCounters (system defined or user defined) in Azure Application Insights.
Caution
We recommend the Azure Monitor OpenTelemetry Distro for new applications or customers to power Azure Monitor Application Insights. The Azure Monitor OpenTelemetry Distro delivers a similar functionality and experience as the Application Insights SDK. It's possible to migrate from the Application Insights SDK using the migration guides for .NET, Node.js, and Python, but we are still working to add a few more features for backwards compatibility.
Using Application Insights to collect EventCounters
Application Insights supports collecting EventCounters with its EventCounterCollectionModule, which is part of the newly released NuGet package Microsoft.ApplicationInsights.EventCounterCollector. EventCounterCollectionModule is automatically enabled when using either AspNetCore or WorkerService. EventCounterCollectionModule collects counters with a nonconfigurable collection frequency of 60 seconds. There are no special permissions required to collect EventCounters. For ASP.NET Core applications, you also want to add the Microsoft.ApplicationInsights.AspNetCore package.
dotnet add package Microsoft.ApplicationInsights.EventCounterCollector
dotnet add package Microsoft.ApplicationInsights.AspNetCore
Default counters collected
Starting with 2.15.0 version of either AspNetCore SDK or WorkerService SDK, no counters are collected by default. The module itself is enabled, so users can add the desired counters to collect them.
To get a list of well known counters published by the .NET Runtime, see Available Counters document.
Customizing counters to be collected
The following example shows how to add/remove counters. This customization would be done as part of your application service configuration after Application Insights telemetry collection is enabled using either AddApplicationInsightsTelemetry() or AddApplicationInsightsWorkerService(). Following is an example code from an ASP.NET Core application. For other type of applications, refer to this document.
using Microsoft.ApplicationInsights.Extensibility.EventCounterCollector;
using Microsoft.Extensions.DependencyInjection;

builder.Services.ConfigureTelemetryModule<EventCounterCollectionModule>(
        (module, o) =>
        {
            // Removes all default counters, if any.
            module.Counters.Clear();

            // Adds a user defined counter "MyCounter" from EventSource named "MyEventSource"
            module.Counters.Add(
                new EventCounterCollectionRequest("MyEventSource", "MyCounter"));

            // Adds the system counter "gen-0-size" from "System.Runtime"
            module.Counters.Add(
                new EventCounterCollectionRequest("System.Runtime", "gen-0-size"));
        }
    );
Disabling EventCounter collection module
EventCounterCollectionModule can be disabled by using ApplicationInsightsServiceOptions.
The following example uses the ASP.NET Core SDK.
using Microsoft.ApplicationInsights.AspNetCore.Extensions;
using Microsoft.Extensions.DependencyInjection;

var applicationInsightsServiceOptions = new ApplicationInsightsServiceOptions();
applicationInsightsServiceOptions.EnableEventCounterCollectionModule = false;
builder.Services.AddApplicationInsightsTelemetry(applicationInsightsServiceOptions);
A similar approach can be used for the WorkerService SDK as well, but the namespace must be changed as shown in the following example.
using Microsoft.ApplicationInsights.AspNetCore.Extensions;
using Microsoft.Extensions.DependencyInjection;

var applicationInsightsServiceOptions = new ApplicationInsightsServiceOptions();
applicationInsightsServiceOptions.EnableEventCounterCollectionModule = false;
builder.Services.AddApplicationInsightsTelemetry(applicationInsightsServiceOptions);
Event counters in Metric Explorer
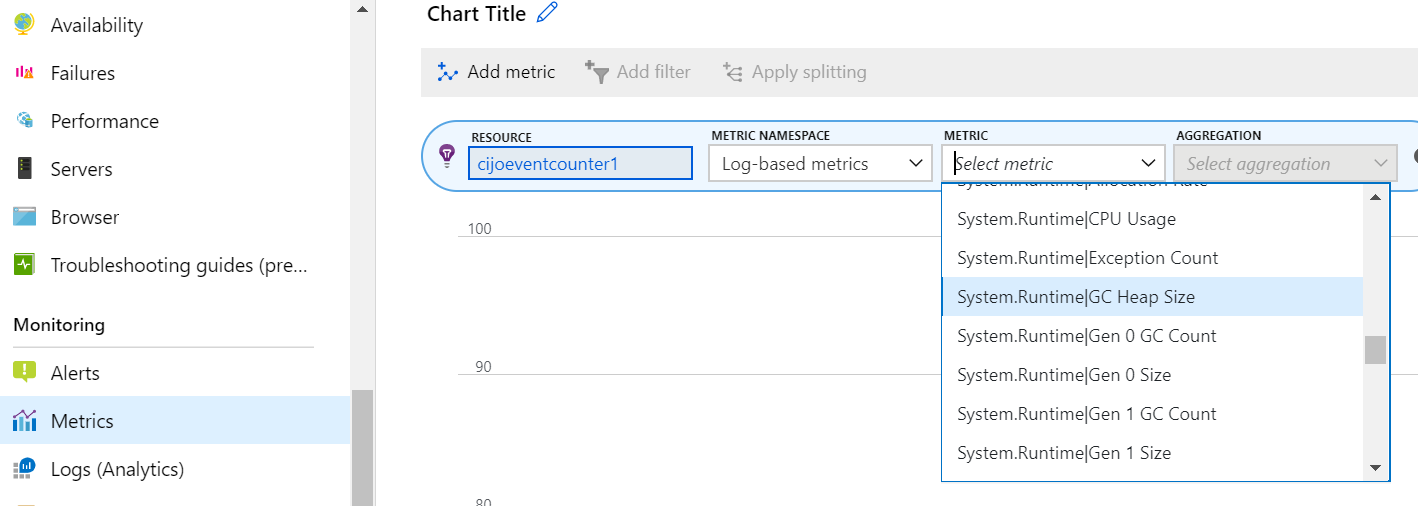
To view EventCounter metrics in Metric Explorer, select Application Insights resource, and chose Log-based metrics as metric namespace. Then EventCounter metrics get displayed under Custom category.
Event counters in Analytics
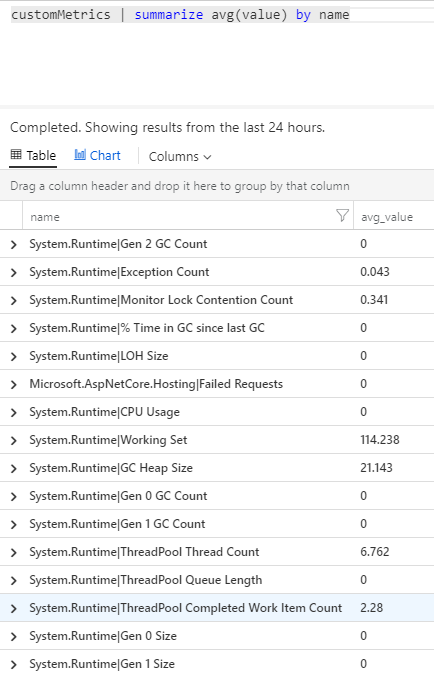
You can also search and display event counter reports in Analytics, in the customMetrics table.
For example, run the following query to see what counters are collected and available to query:
customMetrics | summarize avg(value) by name
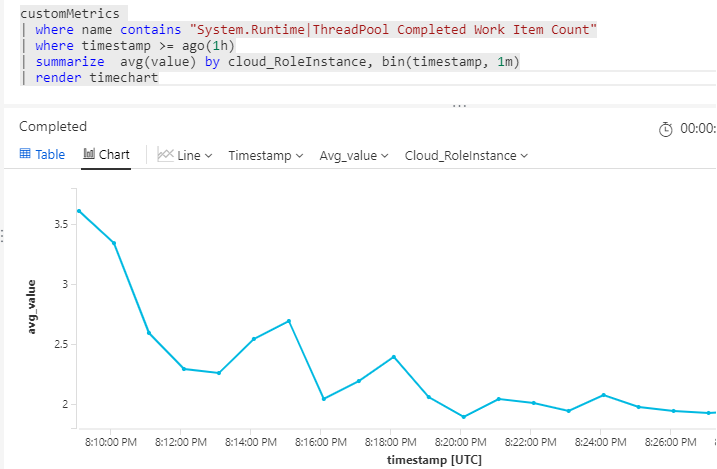
To get a chart of a specific counter (for example: ThreadPool Completed Work Item Count) over the recent period, run the following query.
customMetrics
| where name contains "System.Runtime|ThreadPool Completed Work Item Count"
| where timestamp >= ago(1h)
| summarize  avg(value) by cloud_RoleInstance, bin(timestamp, 1m)
| render timechart
Like other telemetry, customMetrics also has a column cloud_RoleInstance that indicates the identity of the host server instance on which your app is running. The above query shows the counter value per instance, and can be used to compare performance of different server instances.
Alerts
Like other metrics, you can set an alert to warn you if an event counter goes outside a limit you specify. Open the Alerts pane and select Add Alert.
Frequently asked questions
Can I see EventCounters in Live Metrics?
Live Metrics don't show EventCounters as of today. Use Metric Explorer or Analytics to see the telemetry.
I have enabled Application Insights from Azure Web App Portal. Why can't I see EventCounters?
Application Insights extension for ASP.NET Core doesn't yet support this feature.


