What is Azure AI Metrics Advisor?
Important
Starting on the 20th of September, 2023 you won’t be able to create new Metrics Advisor resources. The Metrics Advisor service is being retired on the 1st of October, 2026.
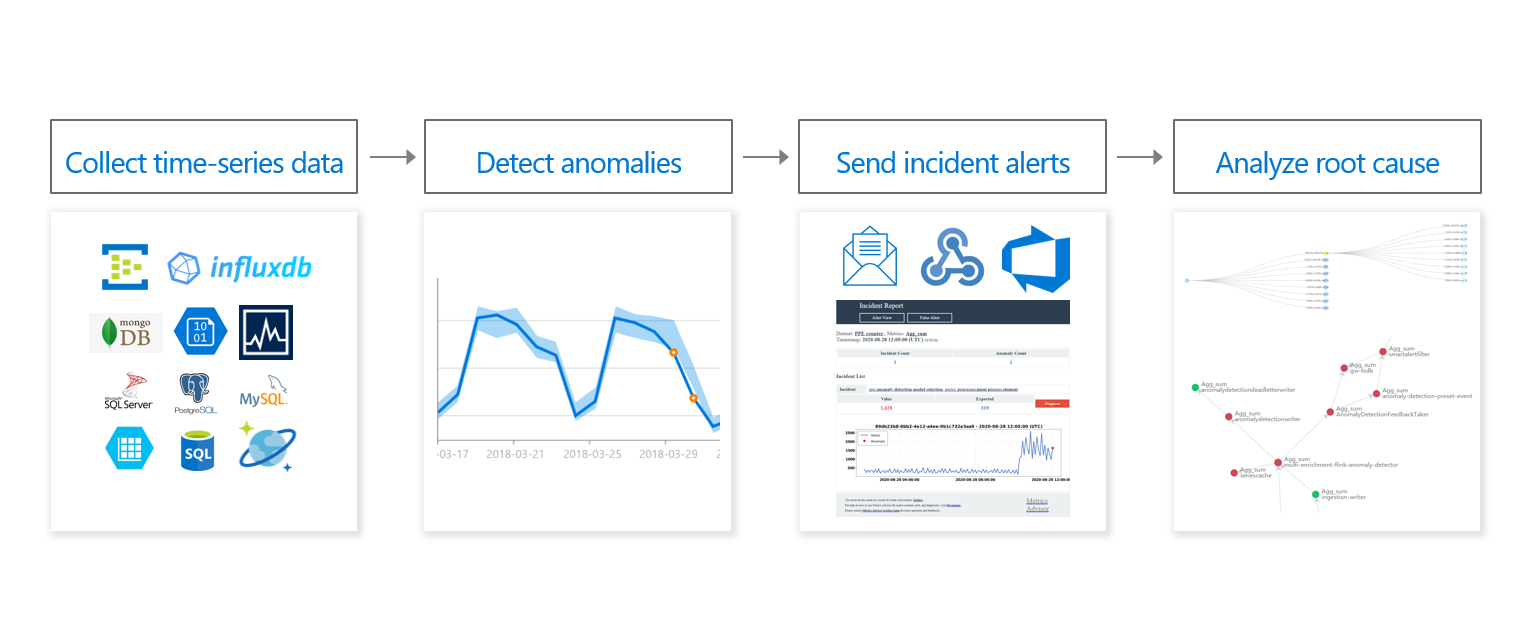
Metrics Advisor is a part of Azure AI services that uses AI to perform data monitoring and anomaly detection in time series data. The service automates the process of applying models to your data, and provides a set of APIs and a web-based workspace for data ingestion, anomaly detection, and diagnostics - without needing to know machine learning. Developers can build AIOps, predicative maintenance, and business monitor applications on top of the service. Use Metrics Advisor to:
- Analyze multi-dimensional data from multiple data sources
- Identify and correlate anomalies
- Configure and fine-tune the anomaly detection model used on your data
- Diagnose anomalies and help with root cause analysis

This documentation contains the following types of articles:
- The quickstarts are step-by-step instructions that let you make calls to the service and get results in a short period of time.
- The how-to guides contain instructions for using the service in more specific or customized ways.
- The conceptual articles provide in-depth explanations of the service's functionality and features.
Connect to a variety of data sources
Metrics Advisor can connect to, and ingest multi-dimensional metric data from many data stores, including: SQL Server, Azure Blob Storage, MongoDB and more.
Easy-to-use and customizable anomaly detection
- Metrics Advisor automatically selects the best model for your data, without needing to know any machine learning.
- Automatically monitor every time series within multi-dimensional metrics.
- Use parameter tuning and interactive feedback to customize the model applied on your data, and future anomaly detection results.
Real-time notification through multiple channels
Whenever anomalies are detected, Metrics Advisor is able to send real time notification through multiple channels using hooks, such as: email hooks, web hooks, Teams hooks and Azure DevOps hooks. Flexible alert configuration lets you customize when and where to send a notification.
Smart diagnostic insights by analyzing anomalies
Analyze root cause into specific dimension
Metrics Advisor combines anomalies detected on the same multi-dimensional metric into a diagnostic tree to help you analyze root cause into specific dimension. There's also automated analyzed insights available by analyzing the greatest contribution of each dimension.
Cross-metrics analysis using Metrics graph
A Metrics graph indicates the relation between metrics. Cross-metrics analysis can be enabled to help you catch on abnormal status among all related metrics in a holistic view. And eventually locate the final root cause.
Refer to how to diagnose an incident for more detail.
Typical workflow
The workflow is simple: after onboarding your data, you can fine-tune the anomaly detection, and create configurations to fit your scenario.
- Create an Azure resource for Metrics Advisor.
- Build your first monitor using the web portal.
- Use the REST API to customize your instance.
Video
Data retention & limitation:
Metrics Advisor will keep at most 10,000 time intervals (what is an interval?) forward counting from current timestamp, no matter there's data available or not. Data falls out of the window will be deleted. Data retention mapping to count of days for different metric granularity:
| Granularity(min) | Retention(day) |
|---|---|
| 1 | 6.94 |
| 5 | 34.72 |
| 15 | 104.1 |
| 60(=hourly) | 416.67 |
| 1440(=daily) | 10000.00 |
There are also further limitations. Refer to FAQ for more details.
Use cases for Metrics Advisor
- Protect your organization's growth by using Azure AI Metrics Advisor
- Supply chain anomaly detection and root cause analysis with Azure Metric Advisor
- Customer support: How Azure AI Metrics Advisor can help improve customer satisfaction
- Detecting methane leaks using Azure AI Metrics Advisor
- AIOps with Azure AI Metrics Advisor - OpenDataScience.com
Next steps
- Explore a quickstart: Monitor your first metric on web.
- Explore a quickstart: Use the REST APIs to customize your solution.