Utilities Leveraging Virtual Earth for Data Visualization
A couple weeks ago I presented at the EUCI (Electrical Utility Consultants Inc.) GIS 2.0 Conference in San Antonio, TX. As a result of this conference and the work of our partners and field sales folks, we’ve seen a significant uptake in utility companies adopting Microsoft Virtual Earth for their applications. In previous posts, I’ve written about Entergy and BC Hydro which were some of the first go live using Virtual Earth in publicly facing applications. Since then, other utilities have published their applications using Virtual Earth, so I figured I’d spend some time going over them.
 Pepco’s Storm Center application is the latest to hit the web. The application allows users to see where outages are occurring in different postal codes. The blue line represents their service area; the green areas represent the different postal codes. The green areas are green because in the respective area there is only up to 50 customers currently experiencing an outage. Their legend describe it best in that blue = up to 500 customers are experiencing outages for a given postal code; yellow – up to 1000; orange – up to 5000; and red – over 5000. For any given area with an outage, you can drill down to see locations affected (rather than areas). This view provides pinpointed locations with different icons for different outage reasons. In the roll over you can see number of customers affected, date and time the outage was reported, the status of the situation, and the earliest time at which the problem might be resolved. Pepco currently serves Washington D.C., Montgomery County and Prince George’s County.
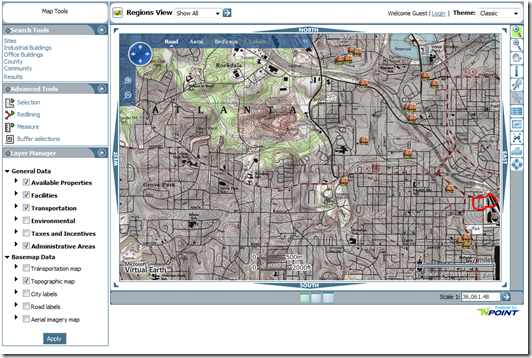
 Georgia Power has a robust web-based GIS tool that they’ve published for viewing and analyzing information about their assets on Microsoft Virtual Earth. The application allows users to view data such as Available Properties, Facilities, Transportation, Environmental, Taxes and Incentives, and Administrative Areas. They’ve also leveraged multiple base map layers for toggling a Transportation Map, Topographic Map, City Labels, Road Labels and Aerial Imagery maps. There’s a tool bar on the right-hand side to control the map – zooming, drag pan, identity, previous map, legend, book mark, layout tools, printing a map and seeing a full view of the map. You can select a specific region of the state from the Regional View list to quickly pan to a specific part of Georgia. They even have two Themes for the site – Classic and Surf (Surf being even more Web 2.0 in that you can drag toolbars around and removes some of the web page clutter).
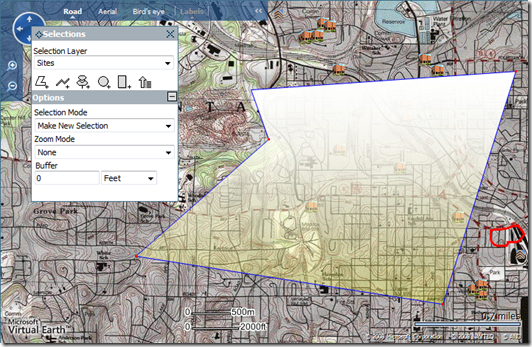
As a GIS guy, I know the built in tools are of most importance and they have some good ones. There’s a Selection Tool which allows you to select an area of the map using polygons, lines, points, circles, or rectangles in search of Community Areas, Counties, Industrial Buildings, Office Buildings or Sites. You can make a New Selection, Add to a Selection, Delete a Selection or Toggle a Selection. You can also specify a buffer around your selection – sick! There’s a Redlining Tool that allows you to annotate the map creating all of the Selection Tool shapes listed above and not just in red – other colors are enabled, as well. There’s a Measuring Tool that allows you to measure shapes on the map in Distance Units – Meters, Feet, Yards, Kilometers or Miles; and, Area Units – Square Feet, Square Meters, Square Kilometers, Square Miles, Acres or Hectares. Finally, there’s a Buffer Tool dedicated to buffering around selected entities existing on the map. Now THIS is some Power, Georgia!
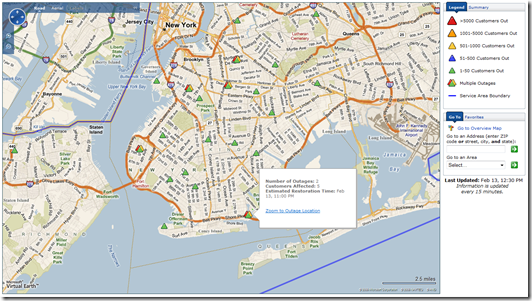
 Con Edison New York launched their Storm Central application to monitor outages using Microsoft Virtual Earth. The application allows users to view where outages are on the map, how many customers are affected and the estimated time at which the outage will be resolved. Also, note the blue boundary line outlining the service area.
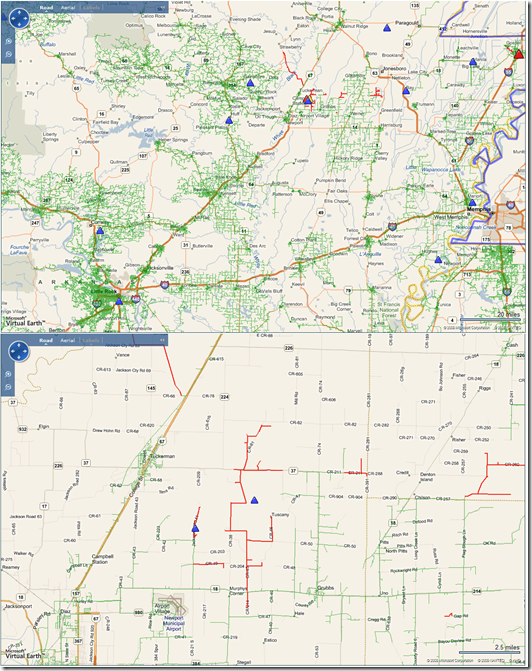
 I also wanted to provide an update on Entergy who has added even more data to their storm center application which leverages Virtual Earth. First off, their service areas are huge serving Arkansas, Louisiana, Mississippi, and Texas so when I talk about their functionality you can appreciate the amount of data we’re talking about here. In their application for finding outages (similar to Pepco and Con Edison), Entergy is publishing the status of their power lines. Yes – the power lines. Every power line that is under their control is on the map as a massive spaghetti network of wires. So, all this green you see on the image below are power lines that are on; the red are those that are off. Flip on the Aerial Photography and you can see where the lines run in physical space. Amazing! Who would’ve ever thought you’d be able to see this level of detail on a public web site?
 Now, I mentioned that much Entergy was one of the first to the web with Virtual Earth and that their site looks similar to Con Edison and Pepco. How does that happen? Insert Microsoft Certified Partner iFactor Consulting. Microsoft has a huge partner community to help add value to our products and since we don’t make a utility outage monitoring system we have partners like iFactor to step in and aggregate Microsoft technologies and build it for our customers – everyone wins! Specifically, iFactor Consulting has released their “Virtual Earth Connector” which brings the rich data from Microsoft® Virtual Earth™ to your Smallworld systems (by General Electrics). By using Spatial Object Manager (SOM) technology, the Virtual Earth Connector enables the use of street and aerial images from Virtual Earth in any Smallworld-based application. Check out this video which steps through the functionality of the Virtual Earth Connector for Smallworld.
There’s some exciting things happening in the utilities sector and mapping. And, isn’t there a huge portion of this proposed US Government Economic stimulus package going toward infrastructure around utilities? Seems like a good industry to be in for the coming years. I’m expecting even more great utility GIS making its way to the web.
CP


