SQL Server 2012 NUMA Node Imbalance
One of my client has been fighting a very strange problem and there is not much literature on the topic, NUMA Node Imbalance.
Server Configuration
8 NUMA nodes with 6 cores each; totaling 48 cores.
256GB memory.
12 Instances of SQL Server; mix of SQL Sever 2012 Latest Build and SQL Server 2008 R2 SP2.
Issue
NUMA node 0 pinned to 100% when all 12 instances are set to automatic CPU affinity setting. This is recommended as default, there have been very few cases where I have had to consider changing this. Generally default is fine, the SQL Server internal engine (or SQLOS)’s scheduler handle is very efficient at distributing load. So why do we have it that NUMA node 0 was pinned?
Initial Troubleshooting
Any time we have performance problem on a server that is running SQL Sever instances; my first question to ask is, is it really SQL Sever? Looking at task manager or resource governor, both show highest CPU utilization of under 5%. This is not surprising, as the CPU in both of these tools provides an average over all CPUs. Therefore there is no easy way to know which instances were causing the NUMA Node 0 on the server to pin. There is nothing obvious that is also visible if I filter through the DMV/DMFs with in each instance.
However due to performance issues, my client decided to manually distribute the load across the 8 NUMA nodes by using CPU affinity mask setting. And sure enough load on NUMA node 0 went down; however he only did it for subset of the instances. So load decreased from 100% to about 70%.
Research and Investigation
While doing investigation, I only found two KB articles that talk about NUMA node performance issue on SQL Server 2012, KB2819662 and KB2926223. However, all the SQL Server 2012 instances are on latest build; therefore, these hot fixes did not apply. I also found KB relating to operating system and NUMA processor pressure issues, however all turned out to be not the issue here. Because even operating system was fully patched.
In order to troubleshoot what is causing CPU pressure issue on NUMA node 0, we decided to move all instances off NUMA node 0 by using CPU affinity mask setting. In doing so we eventually found instances that was causing the load. There were 6 instances that were contributing the load.
After investigating we found, locked pages in memory is enabled by default on each instance and found all affected instances had their maximum set to 4000MB. I remember reading it is no recommended to have maximum memory set to such a low value. Therefore, we increased it to 6000MB. Doing so instantly caused the CPU on NUMA node 0 to return to nominal levels.
Details
Memory settings on SQLInstance01
Processor Affinity Mask Setting – Set to NumaNode03 for SQLInstance01
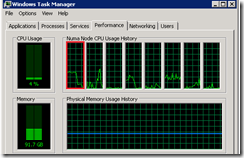
Above is an example of SQLInstance01, set to 4000MB with processor affinity set to NumaNode03. If I look at the CPU now, there is no issues as in screenshot below. However load is not running on NUMA node 0 right now.
CPU Load on NUMA Node 0 (highlighted in red) – Nominal
Processor Affinity Mask Setting – Set to Default for SQLInstance01
Now if I change the instance to use all NUMA nodes, as per the default configuration, as in screenshot above. Processors on NUMA node 0 start to pick up again. Notice the change was almost instantaneously. Since I only did it for one instance it did not cause processor to pin to 100%; however hovered around 40% constant. Imagine that times 6 instances, no wonder NUMA node 0 was pinned to 100%.
CPU Load on NUMA Node 0 (highlighted in red) – After Affinity Set to Auto in SQL Server
Now if I adjust the max memory setting to 8000MB (I tested it with 6000MB); both settings, processor returned to normal performance; as per the screenshots below.
Memory setting on SQLInstance01 – Setting it to 8000MB
CPU Load on NUMA Node 0 (highlighted in red) – After setting the Memory to > 4000MB
Summary
If you are using 64-bit of SQL Server (which is all version now) and have locked pages in memory enabled. Be careful in setting the maximum memory value to a low value. Because of locked pages in memory additional work needs to be done by SQL Server to manage the memory and from looks of it all this work is happening on NUMA node 0. I do not know if this is by design. However setting the memory to value higher then or equal to 6000MB resolved this issue.
I’ll follow up on this if I have any updates, as I’ll be raising the issue internally also.
---
This post is cross posted on my SQLCAN Blog, MSDN Blog, and SQL server Consultation blog.


