SQL Server 2016 – Added information on TempDB Spill events – Showplan
For those that have some experience analyzing query plans, you probably have come across spills to TempDB. These warnings can show up in Hash or Sort operations as a yellow exclamation mark. In fact, although both use TempDB, these are quite different in intent and also in implementation. For instance, a hashing operation that spills will be supported by a Workfile in TempDB, while a sort operation (amongst others) is supported by a Worktable.
A spill that occurs during a Sort operation is known as a Sort Warning . Sort warnings indicate that sort operations do not fit into memory. This does not include sort operations involving the creation of indexes, only sort operations within a query (such as an ORDER BY clause used in a SELECT statement).
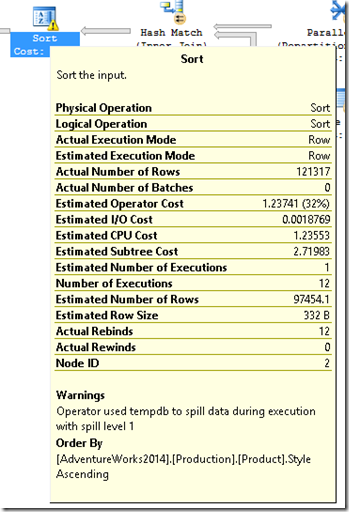
If a query involving a sort operation generates a Sort Warnings event class with a spill level value of 2, the performance of the query can be affected because multiple passes over the data are required to sort the data. In the below example we see a spill level value of 1, meaning that one pass over the data was enough to complete the sort. Still, this is using TempDB, and as such using I/O potentially with negative impact on the query performance.
To understand how impactful the spill is in this context, for a more complete analysis, it is important to know how much I/O we are talking about, and correlate that with the performance requirements for the query.
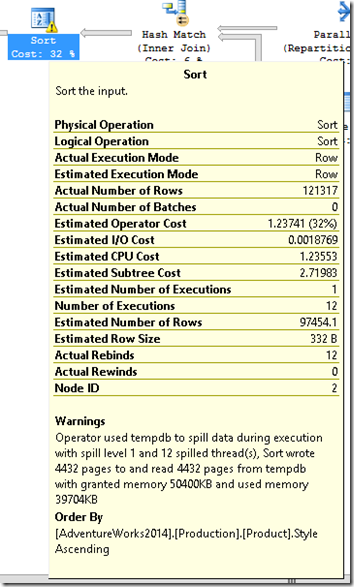
That is why in SQL Server 2016 we have enhanced the information about the spill. As seen below, the left image shows a Sort Warning up to SQL Server 2014, whereas the right image shows the SQL Server 2016 enhancement. There, we now can see how many threads spilled (this example shows a parallel execution), how many pages were involved in the spill, as well as the memory statistics for the operator, all in the Warnings section.
Another type of spill might occur during a Hash operation, which is known as a Hash Warning . These occur when a hash recursion or cessation of hashing (hash bailout) has occurred during a hashing operation.
Hash recursion occurs when the build input does not fit into available memory, resulting in the split of input into multiple partitions that are processed separately. If any of these partitions still do not fit into available memory, it is split into sub-partitions, which are also processed separately. This splitting process continues until each partition fits into available memory or until the maximum recursion level is reached.
Hash bailout occurs when a hashing operation reaches its maximum recursion level and shifts to an alternate plan to process the remaining partitioned data. These events can cause reduced performance in your server.
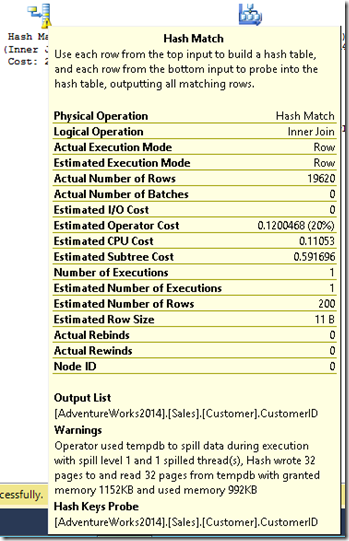
As seen below, the left image shows a Hash Warning up to SQL Server 2014, and the right image shows the SQL Server 2016 enhancement, with the same added information described for the Sort warning.
With this added information, when analyzing the plan, you now have a more complete picture of what a spill meant for your query performance.
Note: these changes where also backported to SQL Server 2012 SP3.
Pedro Lopes (@sqlpto) - Program Manager
Comments
- Anonymous
March 21, 2017
This is a useful addition, thank you!I noticed that this additional debugging information does not appear if the spill occurs in batch mode. Is that expected, or should I filed a Connect issue? (The write_page_count does show as greater than 0 in sys.dm_exec_query_profiles, so it appears the amount of data spilled is being tracked in the batch mode operator, but that the showplan XML does not capture it.)- Anonymous
March 23, 2017
Hello Geoff. You are correct, this is because batch mode operators are tracked differently from row mode. Please go ahead and file the Connect issue. Thanks!- Anonymous
April 05, 2017
The comment has been removed
- Anonymous
- Anonymous
- Anonymous
January 10, 2018
The comment has been removed- Anonymous
May 25, 2018
There are several reasons excessive mem grants may happen. Paul's case is one, but more common causes are skewed or stalled stats, as well as runtime constructs such as MSTVFs that trickle the estimations up the tree. Batch mode memory grant feedback is an adaptive approach to dealing with this scenario.
- Anonymous


