Remote debugging your SharePoint 2010 Sandbox solution
I’m a big fan of sandboxed solutions because in addition to the safety features of running outside of the IIS worker process, you also are more agile as a developer. Farm solutions deployed in the GAC reset your web application after each deployment which means you may have to wait (typically 30 seconds or more) every time you deploy.
Should you find yourself having to debug a sandbox solution remotely you can do the following to get it working.
- First, make sure that you have the Microsoft SharePoint Foundation Sandboxed Code Service running in Central Administration:
Note: In a multiple server farm deployment, you will want to make sure this service is running on only 1 machine to make things simpler.
- You will need to copy the debug symbols to the SharePoint server before you can debug. By default the PDB file will be located in your Visual Studio project’s obj directory:

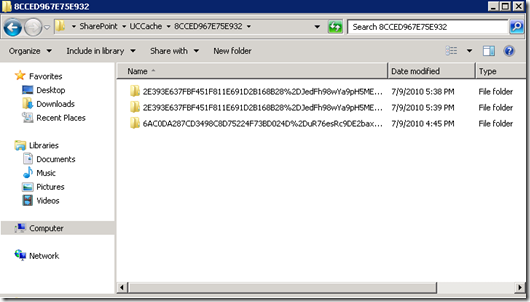
- Copy the PDB file to C:\ProgramData\Microsoft\SharePoint\UCCache. Note that c:\ProgramData is a hidden folder. Within this UCCache folder you should see one or more autogenerated folders that look something like this:

From here you will need to do a search to find your code’s DLL assembly file. Also, this folder may not appear until you first hit the SharePoint page that is using the code.
- Next, you will need to launch the Remote Debugger x64 (MSVSMON.exe) on the remote SharePoint server. By default this is located in C:\Program Files (x86)\Microsoft Visual Studio 10.0\Common7\IDE\Remote Debugger\x64 (note: you need the x64 version). Copy this whole directory to the SharePoint server and launch msvsmon.exe. If it works, you should see something like this:
- Launch Visual Studio 2010 on your developer machine. Both the developer and server machines should be in the same Active Directory domain for managed code debugging. Open your Visual Studio SharePoint project that you wish to debug.
- Launch your web browser and hit the page with your SharePoint code on it
- Go into the Debug menu and select Attach to Process. Type the remote server name in the Qualifier box and hit Enter (note: username/domain name will appear in this box automatically). Select the SPUCWorkerProcess.exe. If your User Code service is running under a different account, you may get a warning when you try to attach.

- Go into Modules under the Debug, Windows menu (Ctrl +D M). If all is well, you should see something like this:

- Set a breakpoint in your code and go back to your web page and hit refresh. At this point, Visual Studio should hit your breakpoint.

- Final note, when I was trying this I saw that new autogenerated folders with my code appeared in c:\programdata. If this occurs, re-copy the PDB file. You may also be able to add the PDB file to your Symbol path. However, I did not get this working on my machine (I got Symbol file does not match the module)
Comments
Anonymous
November 21, 2010
Great Article. This is what am searching for.Anonymous
March 31, 2011
Well described! Thanks for sharing this.Anonymous
June 28, 2011
Nice ! When you create your project are you doing a solution that will be deploy as a sandboxed solution or not ? because me i can't do a sandboxed solution ... thx for your reply.Anonymous
January 11, 2012
Nice post.. I faced the problem of new autogenerated folders everytime I executed the action that caused Sandboxed code to be called. I attached the VS debugger to the SP user code worker process and then closed the msvsmon.exe and opened it again before executing the action. Then it did not create new autogenerated folders on each call.

