Profiling Silverlight in Visual Studio 2010
Looking for an easy way to run performance profiling all your cool new Silverlight applications? Did you know that Visual Studio 2010 has the tools – you just need to know how to find and start them ;-)
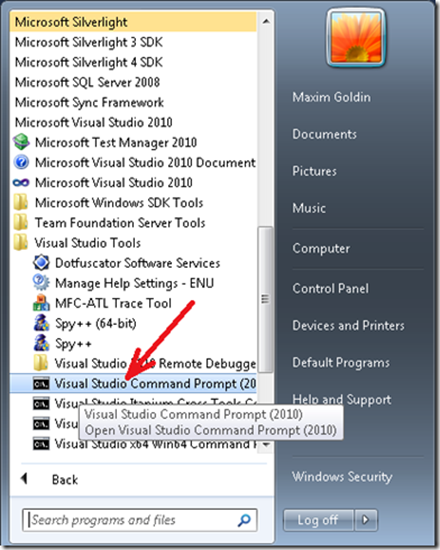
Check-out this blog post about the profiler capabilities in Visual Studio 2010 – sometimes you still have to drop to the command prompt to get what you need:
This command line window has predefined PATH that includes profiler command line tools:
Next, change to the directory where your Silverlight binaries are compiled:
>cd c:\Breakout\Breakout\Bin\Release
Start the profiling session with these commands:
>VSPerfClrEnv /sampleon
>"c:\Program Files (x86)\Internet Explorer\iexplore.exe" C:\Breakout\Breakout\Bin\Release\TestPage.html
>VSPerfCmd /start:sample /output:MyFile /attach:<PID of iexplore.exe process>
<Run your scenario>
>VSPerfCmd /detach
>VSPerfCmd /shutdown
>VSPerfClrEnv /off
See this post for all the details: http://blogs.msdn.com/mgoldin/archive/2010/04/26/vs2010-silverlight-4-profiling.aspx
Happy Profiling!
Technorati Tags: Silverlight,Visual Studio 2010,Profiling


