Reducing the volume (and cost) of data sent to Application Insights
Hello everyone,
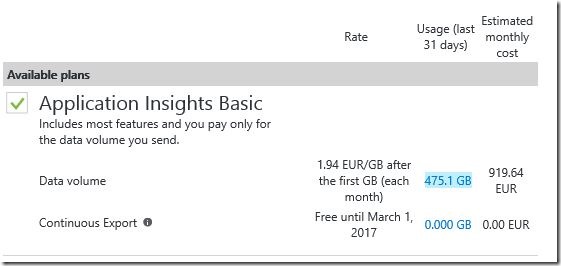
In a project I have been working on recently we relied on Application Insights to gather trace logging on the data which was being processed in our system. To achieve 100% traceability we disabled any kind of sampling on the client side and set Application Insights to ingest 100% of the data. After a couple of days of intensely testing the system, we realized that the data volume had gotten out of control: (as we might have expected)
Oups.
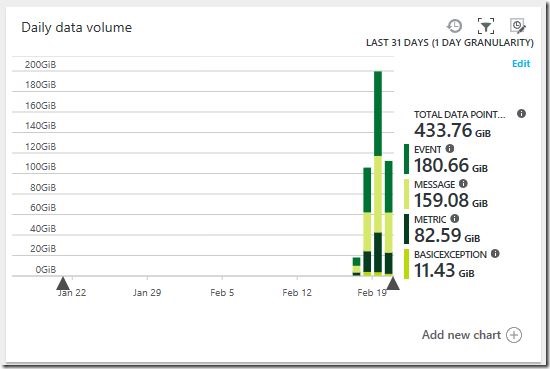
As you can see, within just three days we generated 475 GB of data. Looking at the composition, I realized that we didn’t even look at most of this data. For example, let’s talk about the 180 GB of event data:
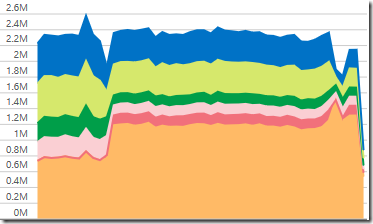
In our application, we used events to track when important things happened in our system – e.g. when a piece of data was queued for processing and when it was actually processed. With this information we set up a couple of graphs to quickly check a couple of things:
- Was data being ingested by the system?
- Was data being processed by the system?
- Did the rate of ingestion / processing match?
- Were there any unexpected spikes?
This is an example of such a graph:
Most of these events consisted only of the name of the function which was called, without any additional parameters - which meant that every single time we called TrackEvent we sent an exact copy. To top if off, we didn’t even look at the unique events themselves. And that got me thinking: If the individual events are not important, why bother sending them to Application Insights? Why not just send a single copy of every unique event to Application Insights (so we don’t lose data), count the number of times we try to send a duplicate telemetry offline and then, in regular intervals, send those numbers as metric data to Application Insights?
Enter the TelemetryToMetrics telemetry processor, which I developed to do just that.
You can set it up in just a few lines in the ApplicationInsights.config file:
<TelemetryProcessors>
  <Add Type="helgemahrt.EnhancedAI.TelemetryProcessors.TelemetryToMetrics, helgemahrt.EnhancedAI">
    <SendInterval>30</SendInterval>
    <PrefixMetricsWithType>true</PrefixMetricsWithType>
    <TelemetryTypesToTrack>EventTelemetry,TraceTelemetry</TelemetryTypesToTrack>
  </Add>
</TelemetryProcessors>
The parameters:
- SendInterval: The interval (in seconds) at which the processor sends metrics it has gathered to Application Insights.
- PrefixMetricsWithType: When sending metrics to Application Insights, it will appear under “Custom” (in the Metrics Explorer) or “customMetrics” (in Analytics) and, at first sight, we won’t know which type of telemetry this data came from. (E.g. events called “MyEvent” will appear as if you had sent a MetricTelemetry item called “MyEvent”) If you set PrefixMetricsWithType to true, the TelemetryToMetrics processor will add a prefix, corresponding to the telemetry type, to the data it uploads. (E.g. events called “MyEvent” will appear as “Event.MyEvent”)
- TelemetryTypesToTrack: The types of telemetry you’d like the processor to track, separated by commas. (MetricTelemetry is not supported at this time)
Once configured, the processor will set up buffers for the different types to track. When it receives a telemetry item, it will do the following:
- Check whether the item is a duplicate and has been sent before (by comparing the name/message and – if present – the properties)
- An item will only be passed on to the next processor (i.e. sent to Application Insights) if it is new (important: only a single copy of each unique telemetry item is sent to Application Insights, so make sure it’s not lost anywhere else – e.g. by client-side sampling or ingestion filtering)
- Independently of the previous step, all items passed to the TelemetryToMetrics processor are counted
- Once every X seconds (determined by the SendInterval parameter), the processor will send the numbers it has collected to Application Insights and reset its counters
If you’re sending telemetry to multiple Application Insights instances, TelemetryToMetrics will create a different set of buffers for each Application Insights instance and track and count items separately.
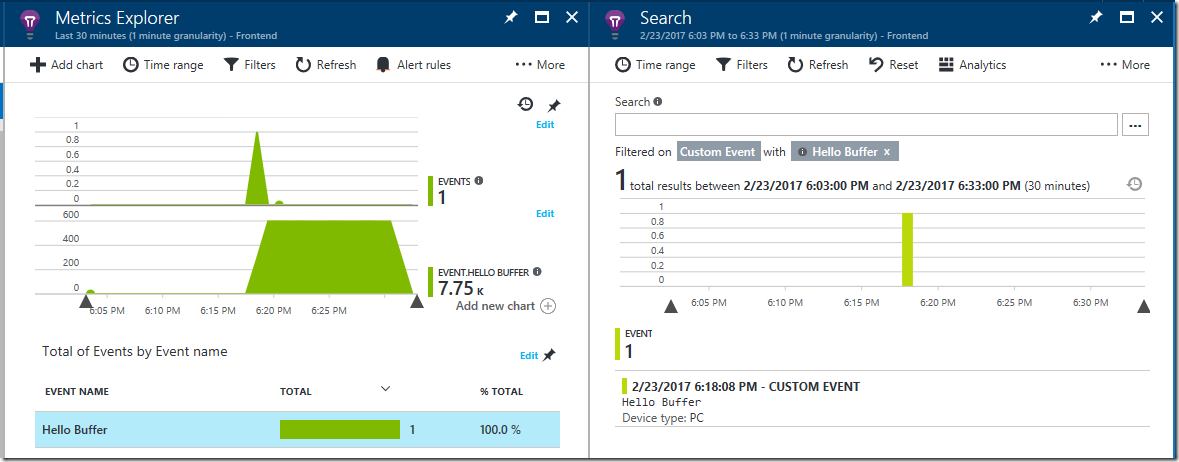
To view your telemetry data in Application Insights when using TelemetryToMetrics go to the Metrics Explorer, add a graph and select “Sum” as the aggregation method for the metrics sent by the processor. You should get something which looks like this:
The first graph shows the events received, the second the custom metrics. Only one EventTelemetry item actually made it to Application Insights. The rest was converted to metrics data.
Looking at Analytics for the same period above, we can see that Application Insights barely received 34 MetricTelemetry items for those 7.75k events. If that’s not a reduction in data volume then I don’t know what is!
I’ve made the source code of the TelemetryToMetrics processor available on GitHub here: https://github.com/helgemahrt/EnhancedApplicationInsights (together with my exception enhancer) Please feel free to comment, share and/or contribute.
I also published the Enhanced Application Insights solution in a NuGet package: https://www.nuget.org/packages/helgemahrt.EnhancedAI
I hope this helps you in your projects!
Cheers,
Helge Mahrt


