Verify cache node functionality and monitor health and performance
This article details how to verify that your cache node(s) are functioning properly and serving traffic. This article also details how to monitor your cache nodes.
Verify cache node installation is complete
Sign in to the Connected Cache server or use SSH. Run the following command from a terminal to see the running modules (containers):
sudo iotedge list
If it lists the edgeAgent and edgeHub containers, but doesn't include MCC, view the status of the IoT Edge security manager using the command:
sudo iotedge system logs -- -f
For example, this command provides the current status of the starting and stopping of a container, or the container pull and start:
You may need to wait up to 30 minutes for the cache node software to complete downloading and begin caching.
Verify functionality on Azure portal
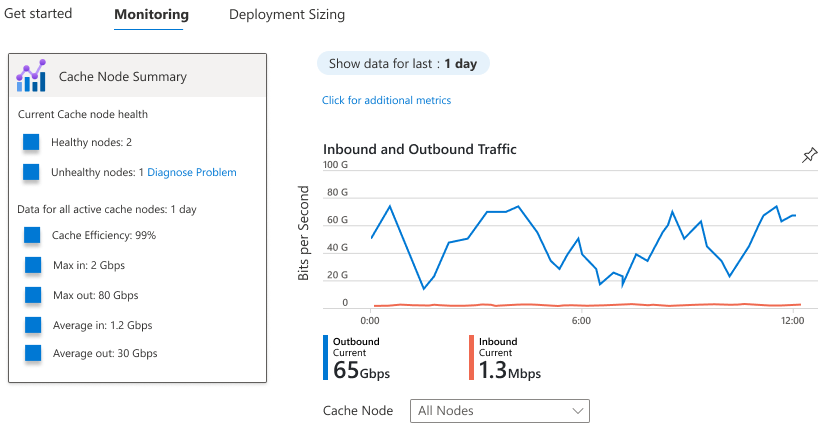
Sign into the Azure portal and navigate to the Overview page. Select the Monitoring tab to verify the functionality of your server(s) by validating the number of healthy nodes shown. If you see any Unhealthy nodes, select the Diagnose and Solve link to troubleshoot and resolve the issue.
Verify functionality on the server
It can take a few minutes for the container to deploy after you've saved the configuration.
To validate a properly functioning Microsoft Connected Cache, run the following command in the terminal of the cache server or any device in the network. Replace <CacheServerIP> with the IP address of the cache server.
wget http://<CacheServerIP>/mscomtest/wuidt.gif?cacheHostOrigin=au.download.windowsupdate.com
If successful, you'll see a terminal output similar to the following output:
HTTP request sent, awaiting response... 200 OK
Length: 969710 (947K) [image/gif]
Saving to: 'wuidt.gif?cacheHostOrigin=au.download.windowsupdate.com'

wuidt.gif?cacheHostOrigin=au.download.windowsupdate.com   100%[========================]
Similarly, enter the following URL into a web browser on any device on the network:
http://<CacheServerIP>/mscomtest/wuidt.gif?cacheHostOrigin=au.download.windowsupdate.com
If the test fails, for more information, see the FAQ article.
Verify BGP routing configuration
To verify your BGP routes are correctly configured for a cache node, navigate to Settings > Cache nodes. Select the cache node you wish to verify BGP routes for.
Verify that under Routing Information, the state of BGP routes received is True. Verify the IP space is correct. Lastly, select Download JSON next to Download BGP Routes to view the BGP routes that your cache node is currently advertising.
If BGP routes received is False, your IP Space is 0, or you're experiencing any BGP routing errors, ensure your ASN and IP address is entered correctly.
Monitor cache node health and performance
Within Azure portal, there are many charts and graphs that are available to monitor cache node health and performance.
Available Metrics
Within Azure portal, you're able to build your custom charts and graphs using the following available metrics:
| Metric name | Description |
|---|---|
| Cache Efficiency | Cache efficiency is defined as the total cache hit bytes divided by all bytes requested. The higher this value (0 - 100%), the more efficient the cache node is. |
| Healthy nodes | The number of cache nodes that are reporting as healthy |
| Unhealthy nodes | The number of cache nodes that are reporting as unhealthy |
| Maximum in | The maximum egress (in Gbps) of inbound traffic |
| Maximum out | The maximum egress (in Gbps) of outbound traffic |
| Average in | The average egress (in Gbps) of inbound traffic |
| Average out | The average egress (in Gbps) of outbound traffic |
For more information about how to build your custom charts and graphs, see Azure Monitor.
Monitoring your metrics
To view the metrics associated with your cache nodes, navigate to the Overview > Monitoring tab within the Azure portal.

You can choose to monitor the health and performance of all cache nodes or one at a time by using the dropdown menu. The Egress bits per second graph shows your inbound and outbound traffic of your cache nodes over time. You can change the time range (1 hour, 12 hours, 1 day, 7 days, 14 days, and 30 days) by selecting the time range of choice on the top bar.
If you're unable to view metrics for your cache node, it may be that your cache node is unhealthy, inactive, or hasn't been fully configured.

