Understanding the Trace Tree Pane
The Trace Tree pane is the focus of the Defect Viewer. Typically, you step through the code in the Trace Tree pane, while watching its effect on the code in the Source Code pane and on the values in the State pane.
The Trace Tree pane is organized into a hierarchical structure with a series of expandable and collapsible nodes. The hierarchy indicates the code elements that caused other elements to be executed. This format helps you to interpret each code branch and to display and hide code sections easily as you step through the trace.
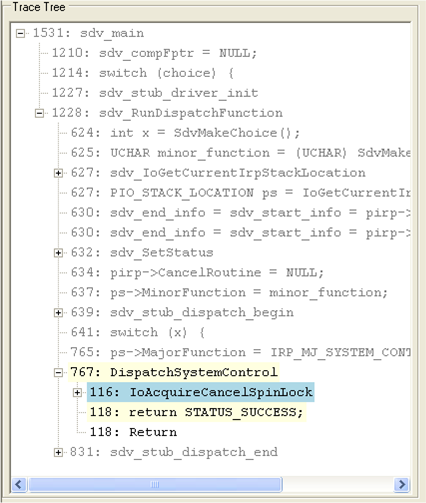
The following screen shot shows an example Trace Tree pane.

Each code element in the Trace Tree pane is preceded by its line number in the source file. This numbering helps you find the code element in the Source Tree window and in the source file.
Some lines of code in the Source Code pane correspond to more than one element in the Trace Tree pane. This situation occurs when the line of code causes more than one action. For example, if a function call parameter is an IRQL, the line of code that includes the function call might also include a call to find the current IRQL, such as:
IoReleaseCancelSpinLock(KeGetCurrentIrql());
In this situation, the Trace Tree pane would include a critical element for the KeGetCurrentIrql function call, a few calls to the SDV operating system model to randomly generate an IRQL, and then a call to IoReleaseCancelSpinLock with the returned IRQL.