How can I debug access violations when running my program outside the Visual Studio debugger?
Set the Just-in-time debugging option and run your program stand-alone until the access violation occurs. Then, in the Access Violation dialog box, you can click Cancel to start the debugger.
How can I debug a C++ access violation?
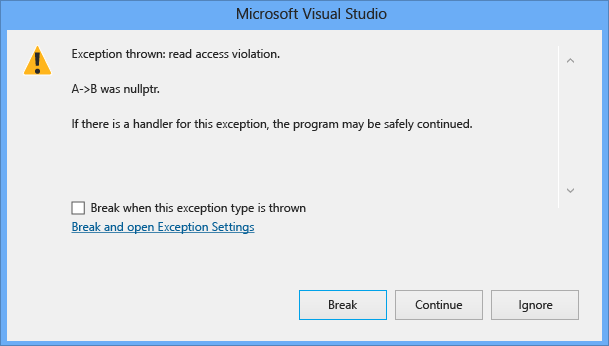
If you get an access violation on a line of code that dereferences multiple pointers, it can be difficult to find out which pointer caused the access violation. In Visual Studio, the exception dialog box explicitly names the pointer that caused the access violation.
For example, given the following code, you should get an access violation:
#include <iostream>
using namespace std;

class ClassC {
public:
  void printHello() {
    cout << "hello world";
  }
};

class ClassB {
public:
  ClassC* C;
  ClassB() {
    C = new ClassC();
  }
};

class ClassA {
public:
  ClassB* B;
  ClassA() {
    // Uncomment to fix
    // B = new ClassB();
  }
};

int main() {
  ClassA* A = new ClassA();
  A->B->C->printHello();

}
If you run this code in Visual Studio, you should see the following exception dialog:

If you cannot determine why the pointer caused an access violation, trace through the code to make sure that the pointer causing the problem has been assigned correctly. If it is passed as a parameter, make sure that it is passed correctly, and you aren't accidentally creating a shallow copy. Then verify that the values are not being unintentionally changed somewhere in the program by creating a Data Breakpoint for the pointer in question to make sure it isn't being modified elsewhere in the program. For more information about data breakpoints, see the data breakpoint section in Using Breakpoints.
How can I find out if my pointers corrupt a memory address?
Check for heap corruption. Most memory corruption is due to heap corruption. Try using the Global Flags Utility (gflags.exe) or pageheap.exe. See /windows-hardware/drivers/debugger/gflags-and-pageheap.
To find where the memory address is modified:
Set a data breakpoint at 0x00408000. See Set a data change breakpoint (native C++ only).
When you hit the breakpoint, use the Memory window to view memory contents starting at 0x00408000. For more information, see Memory Windows.
How can I find out who is passing a wrong parameter value?
To resolve this problem:
Set a location breakpoint at the beginning of the function.
Right-click the breakpoint and select Condition.
In the Breakpoint Condition dialog box, click on the Condition check box. See Advanced Breakpoints.
Enter an expression, such as
Var==3, into the text box, whereVaris the name of the parameter that contains the bad value, and3is the bad value passed to it.Select the is True radio button, and click the OK button.
Now run the program again. The breakpoint causes the program to halt at the beginning of the function when the
Varparameter has the value3.Use the Call Stack window to find the calling function and navigate to its source code. For more information, see How to: Use the Call Stack Window.
When calling a function hundreds of times, how do I know which call failed?
Example: My program fails on a call to a certain function, CnvtV. The program probably calls that function a couple hundred times before it fails. If I set a location breakpoint on CnvtV, the program stops on every call to that function, and I do not want that. I do not know what conditions cause the call to fail, so I cannot set a conditional breakpoint. What can I do?
You can set a breakpoint on the function with the Hit Count field to a value so high that it will never be reached. In this case, because you believe the function CnvtV is called a couple hundred times, you might set Hit Count to 1000 or more. Then run the program and wait for the call to fail. When it fails, open the Breakpoints window and look at the list of breakpoints. The breakpoint you set on CnvtV appears, followed by the hit count and number of iterations remaining:
CnvtV(int) (no condition) when hit count is equal to 1000 (currently 101)
You now know that the function failed on the 101st call. If you reset the breakpoint with a hit count of 101 and run the program again, the program stops at the call to CnvtV that caused it to fail.
Where can I look up Win32 error codes?
WINERROR.H in the INCLUDE directory of your default system installation contains the error code definitions for the Win32 API functions.
You can look up an error code by typing the code in the Watch window or the QuickWatch dialog box. For example:
0x80000004,hr
How can I keep focus when stepping through my app?
Example: My program has a window-activation problem. Stepping through the program with the debugger interferes with my ability to reproduce the problem because my program keeps losing focus. Is there any way to avoid losing focus?
If you have a second computer, use remote debugging. You can operate your program on the remote computer while you run the debugger on the host. For more information, see How to: Select a Remote Computer.
How can I debug Windows API functions?
To set a breakpoint on a Windows API function with NT symbols loaded:
In the function breakpoint, enter the function name together with the name of the DLL where the function resides (see the context operator). In 32-bit code, use the decorated form of the function name. To set a breakpoint on MessageBeep, for example, you must enter the following.
{,,USER32.DLL}_MessageBeep@4To obtain the decorated name, see Viewing Decorated Names.
You can test the decorated name and view it in disassembly code. While paused at the function in the Visual Studio debugger, right-click the function in the code editor or call stack window and choose Go to Disassembly.
In 64-bit code, you can use the undecorated name.
{,,USER32.DLL}MessageBeep
Next steps
You can learn more about native code debugging in Visual Studio using these links: