Run Windows Store apps on a remote machine
Note
This article applies to Visual Studio 2015. If you're looking for the latest Visual Studio documentation, see Visual Studio documentation. We recommend upgrading to the latest version of Visual Studio. Download it here
Applies to Windows only](../Image/windows_only_content.png "windows_only_content")
The Visual Studio Remote Tools app enables you to run, debug, profile, and test a Windows Store app that is running on one device from a second computer that is running Visual Studio. Running on a remote device can be especially effective when the Visual Studio computer does not support functionality that is specific to Windows Store apps, such as touch, geo-location, and physical orientation. This topic describes the procedures to configure and start a remote session.
In this topic
You can learn:
How to connect directly to a remote device
Starting the Remote Debugger Monitor
Configuring the remote debugger
Configuring the Visual Studio project for remote debugging
Prerequisites
To debug on a remote device:
The remote device and the Visual Studio computer must be connected over a network or connected directly through an Ethernet cable. Debugging over the internet is not supported.
A developer's license must be installed on the remote device.
The remote device must be running the remote debugging components.
You must be an administrator on the remote device to configure the firewall during installation. You must have user access to the remote device to run or connect to the remote debugger.
Security
By default, the remote debugger uses Windows Authentication.
Warning
You can also choose to run the remote debugger in No Authentication mode, but this mode is strongly discouraged. There is no network security when you run in this mode. Choose the No Authentication mode only if you are sure that the network is not at risk of from malicious or hostile traffic.
How to connect directly to a remote device
To connect directly to a remote device, connect the Visual Studio computer to the device with a standard Ethernet cable. If the device does not have an Ethernet port, you can use a USB to Ethernet adapter to connect to the cable.
Installing the Remote Tools
Note
Versions and updates
The Remote Tools for Visual Studio 2015 are not supported for previous versions of Visual Studio.
We recommend that you install the update version of the Remote Tools for Visual Studio 2015 that matches the update version of your Visual Studio installation.
The VS debugger is compatible with any combination of versions of VS 2015 and the Remote Tools for VS 2015. However, the newest functionality in Visual Studio requires both Visual Studio and the Remote Tools to be on the most up to date version.
Other diagnostic tools might require the same versions of the remote tools and Visual Studio.
Installing the remote debugging components on a remote device
To run or save the installation program for the remote tools, choose one of the links in this table that matches your version of Visual Studio:
| Version | Link | Notes |
|---|---|---|
| Visual Studio 2015 Update 3 | Remote tools | If prompted, join the free Visual Studio Dev Essentials group or you can just sign in with a valid Visual Studio subscription. Then re-open the link if necessary. Always download the version matching your device operating system (x86, x64, or ARM version) |
| Visual Studio 2015 (older) | Remote tools | If prompted, join the free Visual Studio Dev Essentials group or you can just sign in with a valid Visual Studio subscription. Then re-open the link if necessary.Always download the version matching your device operating system (x86, x64, or ARM version) |
| Visual Studio 2013 | Remote tools | Download page in Visual Studio 2013 documentation |
You can choose to download the install program or you can run it immediately. When you run the install program, accept the user agreement, and then choose Install.
By default, the remote debugging components are installed in the C:\Program Files\Microsoft Visual Studio 14.0\Common7\IDE\Remote Debugger folder.
Starting the Remote Debugger Monitor
Note
Because the remote debugger configures the firewall to allow communication with the Visual Studio host, you must be an administrator on the remote device when you start the remote debugger for the first time.
After you have installed the Remote Tools, choose Remote Debugger on the Start screen. The Remote Debugging Configuration appears the first time that you start the remote debugger.
On the Remote Debugging Configuration dialog box:
If the Windows Web Services API is not installed, choose Install
In the Configure Windows Firewall group, choose the networks that you want to allow connections to. Only those networks that the device is currently connected to are enabled. You must choose at least one network.
Choose Configure remote debugging to set the firewall options and start the remote debugger. Open the Visual Studio Remote Debugging Monitor dialog box to give users permissions to the remote tools and to set other advanced options.
The Visual Studio Remote Debugging Monitor dialog box appears. You can give users permissions to the remote tools and set other advanced option from this dialog box.
Configuring the remote debugger
You use two tools to modify the configuration of the remote debugger.
On the Tools menu of the Visual Studio Remote Debugging Monitor:
Choose Options to change the port number, authentication mode, or timeout interval of the remote debugger.
Choose Permissions to add or remove users that have permission for remote debugging.
Note
Permissions must be granted to every user account that debugs remotely.
You use the Remote Debugger Configuration Wizard to set advanced options for the remote debugger. To open the wizard, choose Remote Debugger Configuration Wizard on the Start screen.
On the Configure the Visual Studio Remote Debugger page, you can choose to run the remote debugger as a service. In most cases, running as a service is not required.
On the Configure the Windows Firewall for Debugging page, you can add or remove the type of networks that you want the remote debugger to connect to. Only those networks that the device is currently connected to are enabled. You must choose at least one network.
Configuring the Visual Studio project for remote debugging
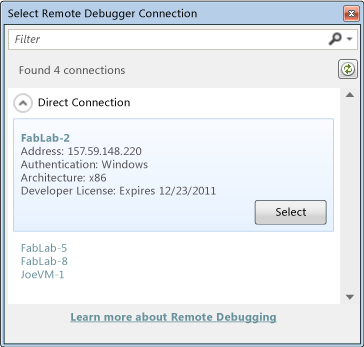
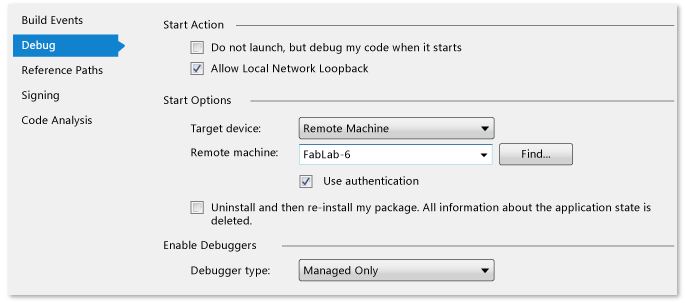
You specify the remote device to connect to in the properties of the project. The procedure differs depending on the programming language. You can type the network name of the remote device, or you can select it from the Select Remote Debugger Connection dialog box.

The dialog box lists only those devices that are on the local subnet of the Visual Studio computer and that are running the remote debugger.
Tip
If you have trouble connecting to a remote device, try entering the IP address of the device. To determine the IP address of a device, open a command window and then type ipconfig. The IP address is listed as IPv4 Address.
Choosing the remote device for C# and Visual Basic projects

Select the project name in Solution Explorer and then choose Properties from the shortcut menu.
Select Debug.
Choose Remote Machine from the Target Device list.
Enter the network name of the remote device in the Remote Machine box or choose Find to choose the device from the Select Remote Debugger Connection dialog box.
Choosing the remote device for JavaScript and C++ projects

Select the project name in Solution Explorer and then choose Properties from the shortcut menu.
Expand the Configuration Properties node and then select Debugging.
Choose Remote Debugger from the Debugger to launch list.
Enter the network name of the remote device in the Machine Name box or choose the down arrow in the box to choose the device from the Select Remote Debugger Connection dialog box.
Running a remote debugging session
You start, stop, and navigate a remote debug session the same way you do a local session. Before you start debugging, make sure the Remote Debugging Monitor is running on the remote device.
Then choose Start Debugging on the Debug menu (Keyboard: F5). The project is recompiled, then deployed to and started on the remote device. The debugger suspends execution at breakpoints, and you can step into, over, and out of your code. Choose Stop Debugging to end your debug session and close the remote app. For more information, see Debug apps in Visual Studio.
See Also
Testing Store apps with Visual Studio
Debug apps in Visual Studio