Run Apache JMeter load tests with Azure DevOps
Azure Test Plans
Note
While Azure DevOps cloud-based load testing service is deprecated, Azure Load Testing Preview is available. Azure Load Testing Preview is a fully managed load testing service that enables you to use existing Apache JMeter scripts to generate high-scale load. To learn more, see What is Azure Load Testing Preview?. To learn more about the deprecation of Azure DevOps load testing and other, alternative services see Changes to load test functionality in Visual Studio and cloud load testing in Azure DevOps.
Before you start your load testing:
- Create your Azure DevOps subscription, if you don't have one already.
To run a JMeter load test:
Sign into Azure DevOps.
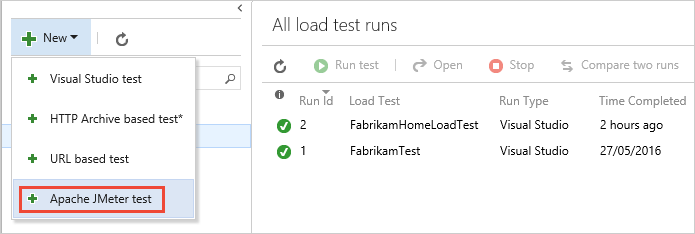
Go to the Load Test section of Azure Test Plans (see Web portal navigation), open the + New menu and choose Apache JMeter test.
Enter your load test parameters. To run your test near to where your users are located, select a closer location for your load test. Then start your test when you're ready.
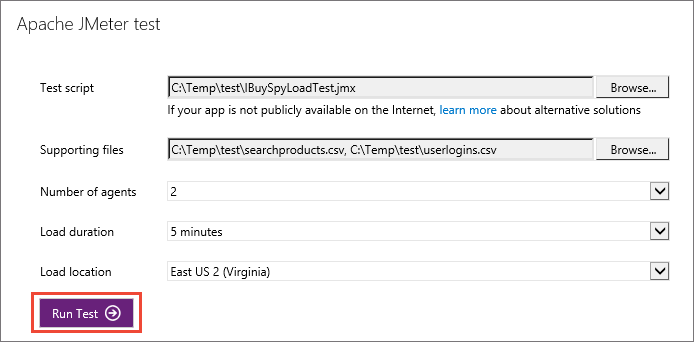
For information about the scripts and supporting files used for JMeter web tests, see Build a Web Test Plan on the Apache JMeter website.
As the test runs, you see live information about the progress of the test. You can stop the test by using the Abort link on the toolbar.
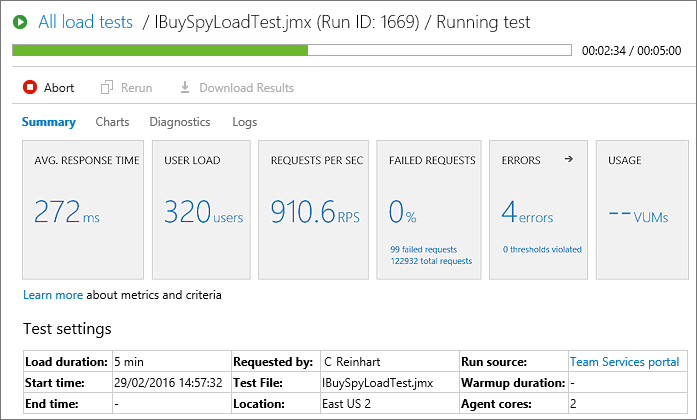
When your test is done, look at the results to see how well your app performed. For example, you can see an overview of your app's performance in the Summary page. This page shows all of the main metrics such as average response time, user load, requests per second, failed requests, any errors that might have occurred, and test usage.
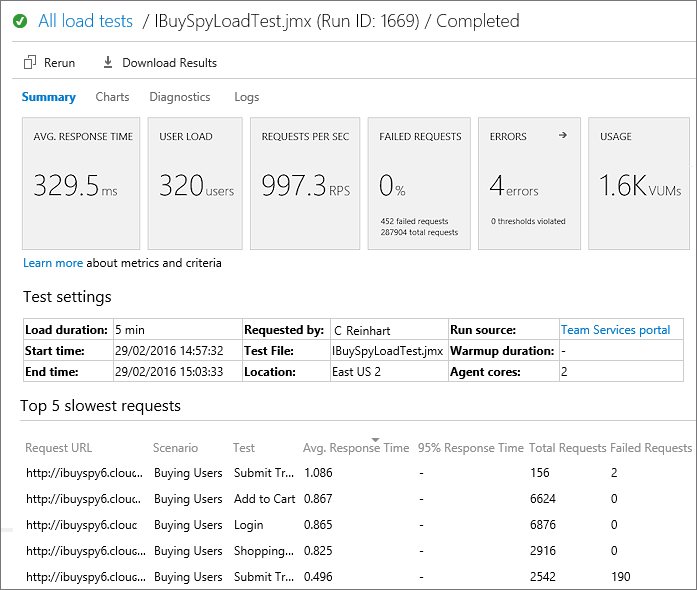
The lower section of the Summary page shows the settings used for the test, and details of the five slowest requests during the test. If there are any transaction tests, the page will also show the five slowest of these. Use the
 icon above a column to sort the list based on the contents of that column.
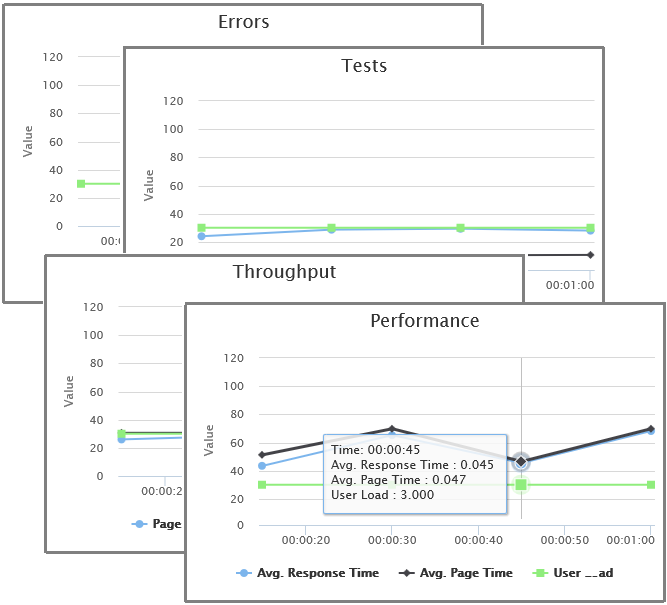
Open the Charts page to see a graphical representation of the test results over time. The charts show the average performance, throughput, errors, and the results of each test request. Hover your mouse pointer over a chart to see more details.
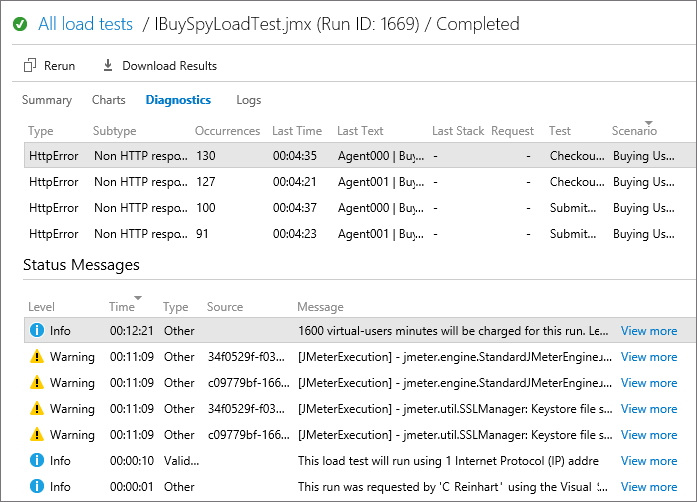
Open the Diagnostics page to see detailed information such as a list of errors and status messages.
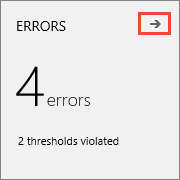
You can also use the
 icon in the Errors section of the Summary page to go directly to the
Diagnostics page.
Open the Logs page to see a list of test runs. Choose the link in the Attachment column to download the detailed log as a text file.

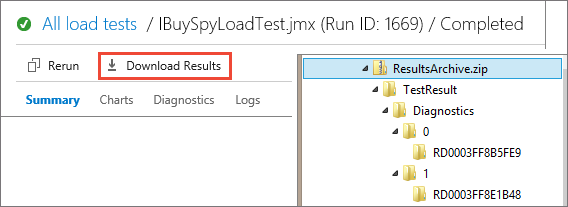
If you have a favorite listener that you use to analyze results in the JMeter IDE, download the test results in .CSV format and the logs as a zip file from the Download Results link.
To run the same test again, choose Rerun.

Now see how you can view and compare your load test runs.
See also
- FAQs for load testing
- Load test with Visual Studio
- Load test with Azure DevOps
- Tutorial: Run load tests before release
- Analyze load test results using the Load Test Analyzer
Help and support
Report any problems on Developer Community, get advice on Stack Overflow, and get support via our Support page.