Semantic metrics
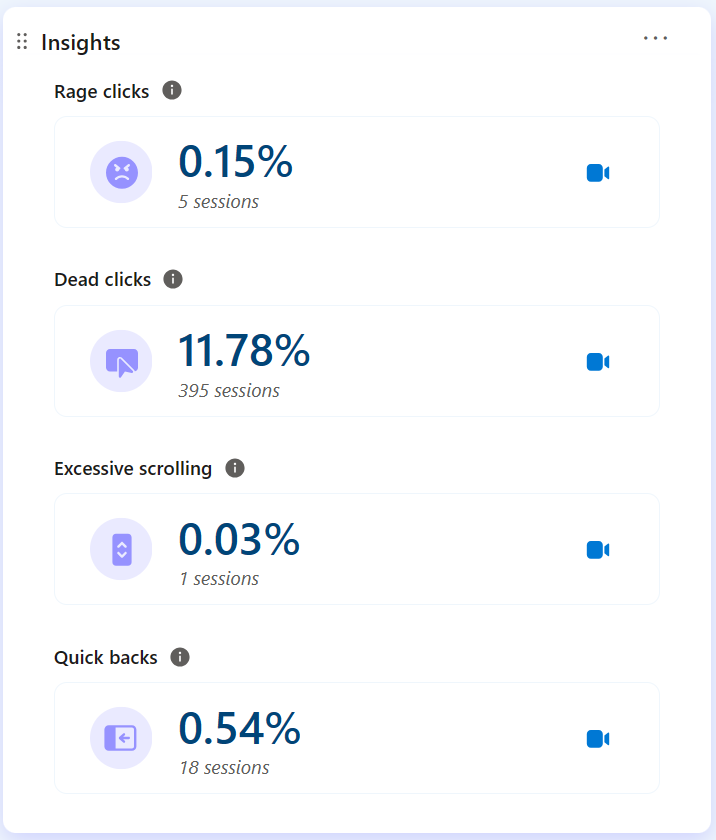
Excessive scrolling
A user session is flagged as 'excessive scrolling' if that session has higher amounts of vertical scrolling than the expected average. The excessive scroll could indicate inaccessible or frustrating UX, poor content relevance, discovery, or nonstandard site interactions. Excessive scrolling can be a strong indicator that a given page could be contributing to the site abandonment.

Rage clicks
A page view or user session is flagged with 'rage click' if the user clicks multiple times in a clustered area in rapid succession. Each of these clustered clicks is marked as a rage click. Rage clicks can be strong indicators of user frustration, where users expect to be interactive elements. These clicks can also indicate key events in a session where a user might be uniquely frustrated.

Dead clicks
Similar to rage clicks, 'dead clicks' suggest a poor user experience. Click interactions are marked as dead clicks when a user clicks on an element but gets no feedback in a reasonable amount of time. This click means that the visual status doesn't change, and there's no navigation away from the page. A dead click can signify broken elements, high latency requests, or misleading UX.

Quick backs
A 'quick back' is a click that leads users away from the current page to another website. The user doesn't find the navigation useful and returns to the original page or website under a certain threshold of time. Clarity detects Quick backs when a user moves from a new to previous page in shorter time than defined threshold (the dwell time for that page). In future releases, this metric adapt to your specific site.

What is click dwell time?
Click dwell time is the time a user spends on the page they clicked. For external sites, it's the amount of time from the click to when users resume activity.
For internal sites, it's the amount of time a user spends on a specific subpage before they return to source page or another page.
JavaScript errors
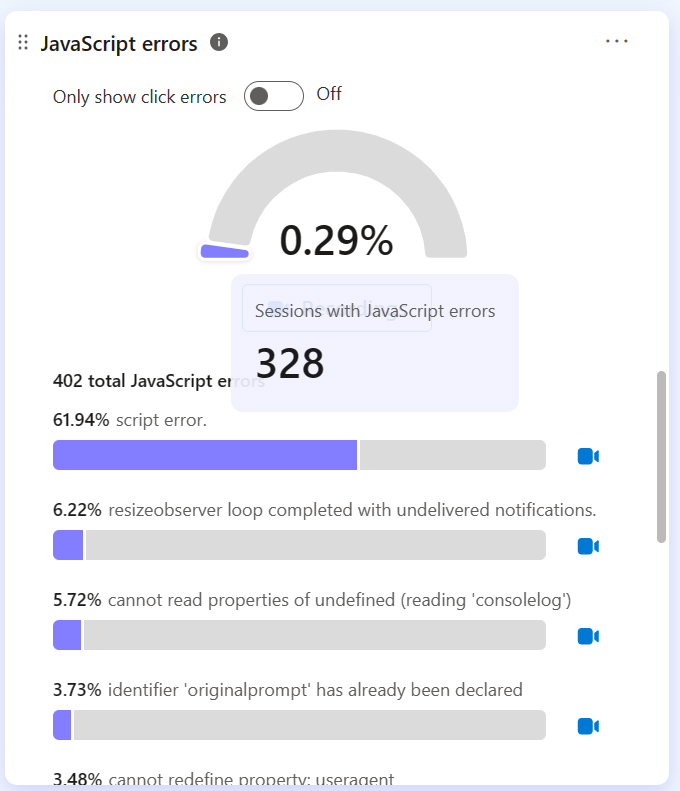
JavaScript errors occur while executing JavaScript on the browser. You can view the total number of JavaScript errors along with the breakdown of each JavaScript error and watch recordings related to each error. Select show more or show less to adjust the list.
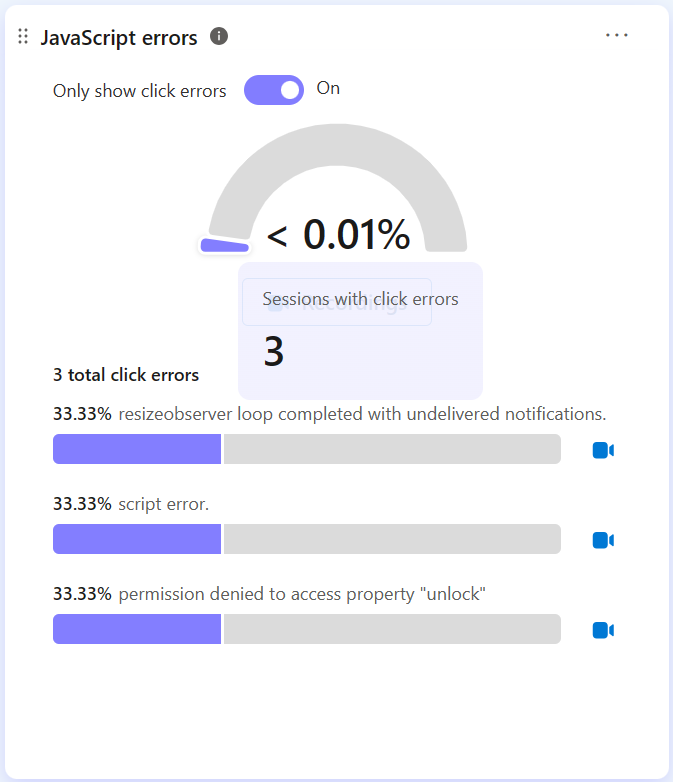
Click errors
Click errors are JavaScript errors that occur after a user click. Every time a click results in a JavaScript error, the session is automatically tagged. You can now filter to view the tagged sessions to understand what went wrong. Toggle Only show click errors to start viewing click errors.
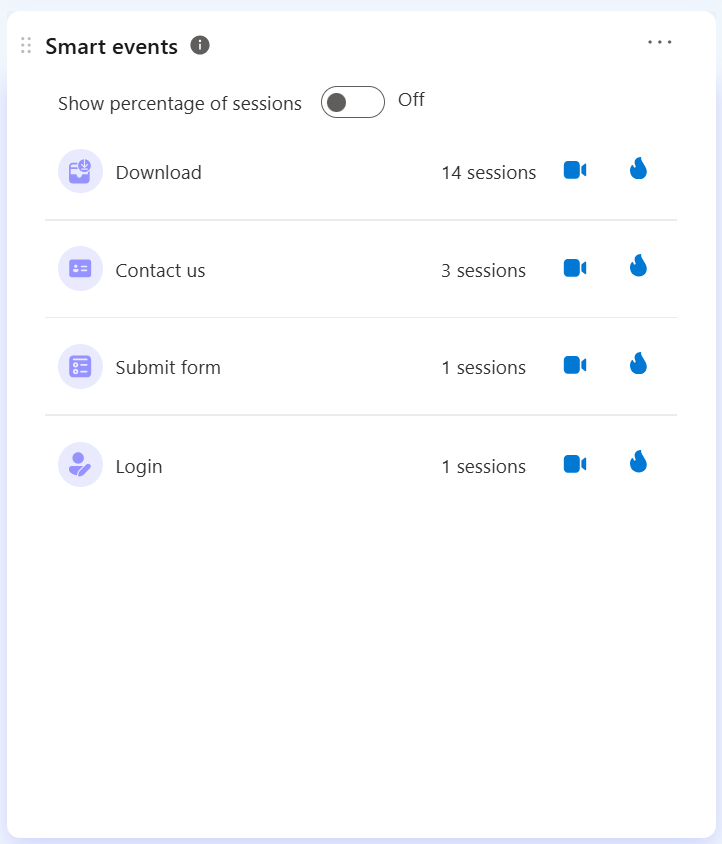
Smart events
Smart events track key user actions on your website, making it easy and fast for you to view the data that matters. Clarity automatically defines smart events for you, and you can customize them or define new events - all code-free. Select the recordings icon or heatmaps icon to view the corresponding filtered data. Learn more about smart events.
Recipe insights
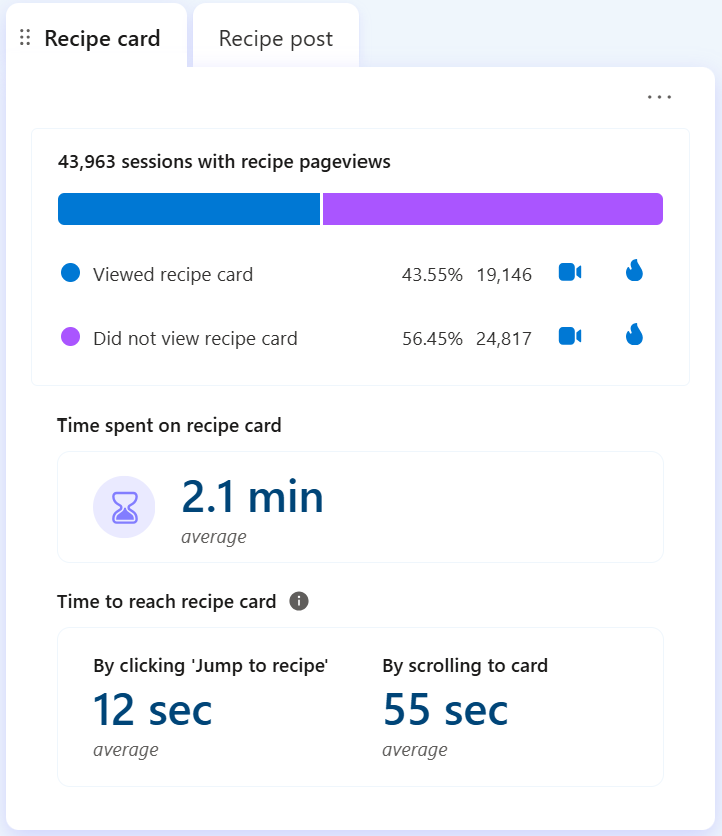
Exclusive to food blogs, Clarity's Recipe Insights enable food bloggers to measure recipe views and conversions, providing comprehensive insights into user behavior and preferences. Monitor key metrics such as recipe views per session, percentage of sessions with recipe page views, and total session counts to refine content strategies and enhance reader engagement. Learn more about Recipe insights.
Funnels
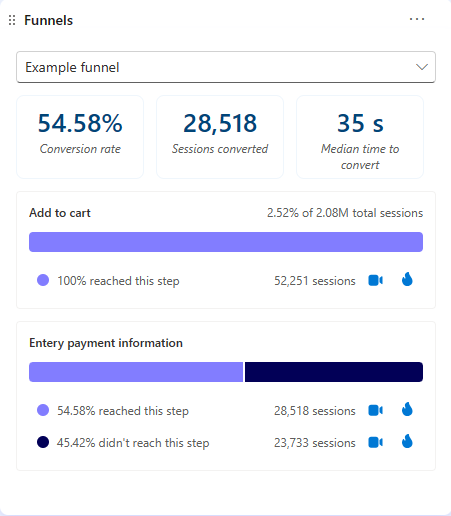
Funnels represent a sequence of user actions, providing a detailed view of user progression through each phase of the flow. You can create funnels with no code to view gain insights to your unique scenarios. Learn more about funnels.
FAQ
For more answers, refer to Insights FAQ.