My Favorite Features: Managing Projects with the Backlog, Sprint Planning and Taskboard Features in Team Foundation Server 11
In my earlier post on Continuous Value Delivery, I talked about the role that features like the backlog, sprint planning, and taskboard play in tracking requirements and managing the development process. In this post, I’ll dive deeper into what this all looks like in action. I’ve been using these features in my personal coding projects against the new Team Foundation Service preview (https://www.tfspreview.com). However, they will ship as a part of Team Foundation Server 11 as well.
Backlog Management
Each one of my projects has a healthy list of items I need to work on. I use the Visual Studio 11 Scrum process template, so the work items in my list are called Product Backlog Items, or PBIs. If you’re using one of the other available templates, these work items would be known as User Stories, Requirements, or something different. Regardless of the name and definition of the work item, the Product Backlog features work exactly the same.
One of the first things you’ll notice is the new UI we’ve built in our Team Foundation Server web client. It’s designed to be very simple to use and optimized for common tasks like adding new PBIs, assigning PBIs to upcoming iterations, and even forecasting progress through the backlog.
Adding Work
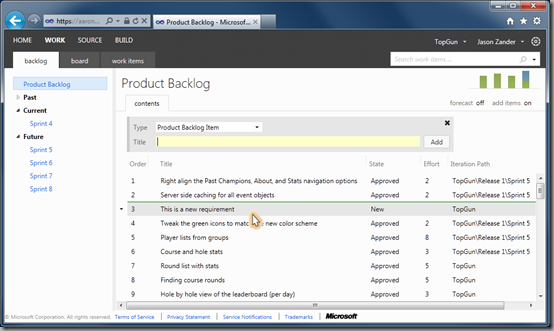
Let’s start with adding and prioritizing work. First off, how do you add something new to the Product Backlog? At the top of the backlog is a small panel we call the “add panel”. You can turn this panel on or off using the view filters on the right side of the page.
Figure 1 – The Add Panel
When turned on, you simply select the work item type, enter a title, and click Add. The new work item is then added to your product backlog above the item you had selected.
Figure 2 - Adding a new PBI
The add panel has a set of defaults associated with it that automatically set work item field values for you. This is nice because it allows you to enter details in your work item forms that aren’t “in your face” each time you want to work with the backlog. (Please note, however, that we don’t allow work item customization on the Team Foundation Service Preview at this time.) Below is a screenshot after the PBI has been added.
Figure 3 - PBI Added
You can also open any work item quickly on the backlog to fill out additional details. In this case, let’s put an estimate on the new requirement we just added. As I’m sure many of you do, I’ve been using the Fibonacci sequence to do my estimating for items on my backlogs. In this case, we’ll add an estimate of three. You can also see in the form that I’m able to add a detailed description to the PBI as well as acceptance criteria that define when this PBI will be done.
Figure 4 - Adding an Effort Estimate
Prioritizing Work
Now that you’ve seen how easy it is to add new work, let’s talk about probably the most common use of the product backlog – prioritizing work. This is where things start to get really fun. Let’s now use our example above and move the new PBI we just added to the top of the backlog. To do this, we’ll just click and drag it up to the top (as pictured below). If we want to move it down, we do the same. It’s really simple.
Figure 5 - Reprioritizing the Backlog
We can also use these drag and drop features to assign work to an upcoming sprint. To place a PBI in an upcoming sprint we simply drag it over to the list of sprints on the left side of the screen, as shown below.
Figure 6 - Sprint Assignment
Once that’s done you’ll notice that the Iteration Path field is updated to reflect the sprint selected. Again, you can see how the UI has been designed to make common tasks like this simple.
Forecasting Progress
The final feature I want to highlight on the on Product Backlog is something called “forecast lines”. What are these forecast lines? Well, they’re simply a way to use your existing velocity (the amount of effort you’re able to complete in each sprint) and overlay that on top of your backlog. By doing this, you can start to forecast how the remaining backlog will lay out over future sprints. Let’s take a look.
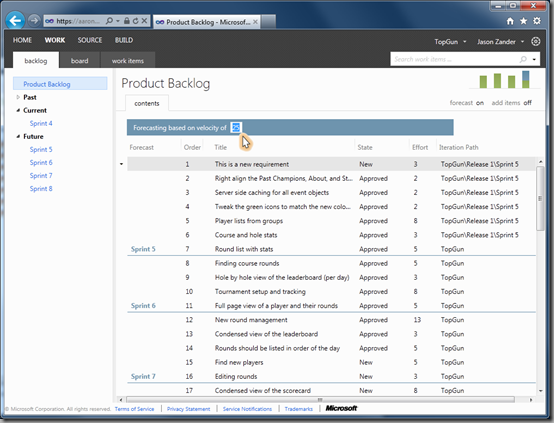
I’m going to start by turning on the forecast lines by clicking the forecast toggle just above the backlog. You’ll then notice a set of horizontal lines drawn through your backlog at set intervals. In this example, my velocity is 15 units of effort.
Figure 7 - Forecast Lines
The forecast lines are showing me that based on a forecast of 15, I can complete the first four items on my backlog. The forecast is also telling me that item five on my backlog is too big for me to complete in the next sprint (sprint 5). If this is a problem, I can simply reprioritize by dragging and dropping. I can also change my estimated velocity, as shown below, to see how the forecast changes.
Figure 8 - Adjust Velocity Estimates
It’s important to note that forecast lines aren’t actually changing the plan. For example, you’ll see that the Iteration Path values remain unchanged when the forecast is turned on. Forecast lines are just another tool you can use to help you better understand the work your team is doing.
Planning and Running a Sprint
After your backlog is created and prioritized, the final step is to actually do some work! In our example we’ve already added a few items into Sprint 5. I’m going to now click on Sprint 5 to open the sprint planning view. Here, I can assign work to members of my team, load balance the work across the sprint, and break down each PBI into a set of actionable tasks. There are some options here to help you understand capacity per team member and capacity per activity. But I obviously don’t use those features much for my personal coding project, as I’m just a team of one. J That said, I’d encourage you to check them out as they are designed to help you make a strong commitment to your sprint.
Figure 9 - Planning a Sprint
After my plan is set, I use the taskboard to track progress on my work. The new taskboard is designed to make this really simple. You just drag and drop tasks from left to right as they move from “Not Started”, to “In Progress”, to “Done”. It’s easy to update hours on the board, and you can see your overall progress on the live burndown chart.
Figure 10 - Taskboard
We’re also using these tools ourselves, to develop the Visual Studio product. I’ve included a picture below of one of our own teams here in Redmond using the taskboard during a daily standup.
Figure 11 - Daily Standup
The icing on the cake is that all my tasks for the sprint show up directly in Visual Studio 11 in the My Work pane, as shown below. And when I check-in my changes, the tasks are automatically closed, and the hours zero’d out.
Figure 12 - My Work in Visual Studio 11
Conclusion
As you start using Team Foundation Server 11, I hope your teams find success managing your backlogs and executing sprints with these new features. To learn more, I recommend visiting MSDN. I’m looking forward to hearing your feedback and learning more about your experience with the new tools.
Enjoy!
Follow me at twitter.com/jlzander .
Comments
Anonymous
May 30, 2012
Is there a way to change the default so that it doesn't automatically close your tasks? We use continuous integration so a task will usually require many small check-ins before it is complete. But the number of hours remaining dwindle till it is completed.Anonymous
May 31, 2012
@Dan - there is. On the pending changes window you can choose to "associate" the check-in with the task rather than closing it. It's one click away. This will simply create a link between the check-in and the task w/o closing it. If you use a custom process template on an on-premise server, you can also completely remove the check-in action from the task.Anonymous
May 31, 2012
The comment has been removed


