Generating Random Non-Uniform Data In C#
When building simulations of real-world phenomena, or when generating test data for algorithms that will be consuming information from the real world, it is often highly desirable to produce pseudo-random data that conform to some nonuniform probability distribution.
But perhaps I have already lost some readers who do not remember STATS 101 all those years ago. I sure don't. Let's take a step back.
The .NET Framework conveniently provides you with a pseudo-random number generator that produces an approximately uniform distribution (*) of doubles between zero and one. By a "uniform distribution" we mean that if you took a whole lot of those random numbers and put them in two buckets, based on whether they were greater than one half or smaller than one half, then you would expect to see roughly half the numbers in each bucket; there is no bias towards either side. But moreover: if you took those same numbers and put them in ten buckets, based on whether they were in the range 0.0-0.1, 0.1-0.2, 0.2-0.3, and so on, you would also expect to see no particular bias towards any of those buckets either. In fact, no matter how many buckets of uniform size you make, if you have a large enough sample of random numbers then each bucket will end up with approximately the same number of items in it.
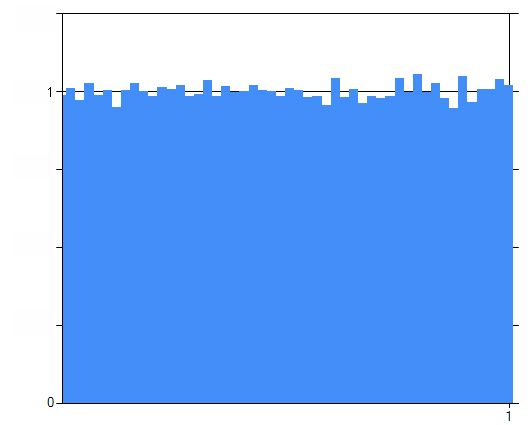
That's what we mean by a "uniform probability distribution": the number of items you find in the bucket is proportional to the size of the bucket, and has nothing to do with the position of the bucket. Here I've generated one hundred thousand pseudo-random numbers between zero and one, put them into fifty buckets, and graphed the number of items found in each bucket: (**)
Such a graph is called a histogram. As you can see, each of the 50 buckets contains approximately 2% of the total, and there seems to be no particular pattern to which buckets were lucky enough to get a few more than average. This histogram is entirely characteristic of a uniform distribution.
Now let's consider for a moment the relationship between the geometry and probability. Suppose we chose one of those data at random, from the hundred thousand points. What is the probability that it was in bucket 25? Obviously, the "height" of that bucket on the graph divided by the total number of items. But geometrically, we could think of this probability as the area under the curve limited to the region of bucket 25 divided by the total blue area.
Do you notice something vexing about this graph though? The axes are completely determined by the arbitrary factors that I chose in running my simulation. Let's normalize this. We'll re-label the horizontal axis so that it represents the highest value that would have been put in that bucket. How shall we re-label the vertical axis? Well, we said that the probability of a particular datum being found in a particular bucket was proportional to the area of that bucket. Therefore, let's recalibrate the axis such that the total area of the graph is 100%. That way, the answer to "what is the probability of a given item being found in such and such a region?" is precisely the area of that region:
This normalization has the beautiful property that no matter how many random numbers we generate, and no matter how many buckets we put them in, every histogram will look more or less the same, and will have the same labels on the axes; the distribution will go from zero to one on both axes and the total area will always be 100%.
Now imagine what would happen in the limiting case. Suppose we kept generating more and more numbers; trillions of them. And we made the buckets smaller and smaller. If you squint a bit, you might as well just say that you're going to do a graph as though the whole thing were continuous, and just draw the extraordinarily simple line graph:
And there you have it; the continuous uniform distribution. But that is certainly not the only distribution! There is the famous "bell curve" or "normal" distribution. The range of the normal distribution is infinite on both ends; a normally-distributed random value can have any magnitude positive or negative. Here's Wikipedia's image of four different bell curves:
Remember, these are just the limiting case of a histogram with a huge number of buckets and a huge number of samples. With these distributions, again, the probability of a value being found in a particular range is proportional to the area under the curve in that range. And of course, the area under each one is the same -- 100% -- which is why the skinny bell is so much taller than the wide one. And notice also how the vast majority of the area is very, very close to the peak in every case. The normal distribution is a "thin, long tail" distribution.
There are other distributions as well. For example, the Cauchy distribution also has the characteristic bell shape, but its tail is a bit "fatter" than the normal distribution. Here, again from Wikipedia we have four Cauchy distributions:
Notice how much fatter those tails are, and how the "bell" correspondingly has to be narrower to ensure that the area still adds up to 100%.
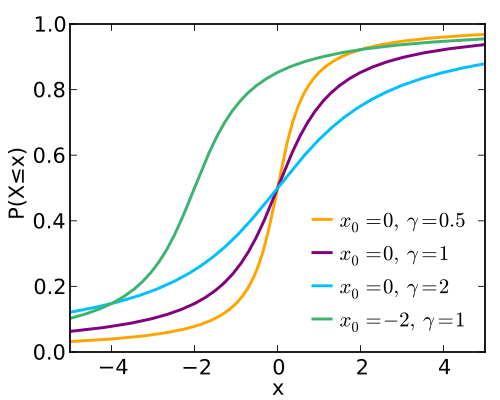
You know something that is still a bit odd about these graphs though? Because the probability is proportional to the area under the curve, the actual value of the curve at any given point isn't really that meaningful. Another way to characterize a probability distribution is to work out the probability of a given number or any number less than it being chosen; that is the area under the curve to the left of that number. Of course, the area under the curve is simply the integral, so let's graph the integral. We know that such a curve is going to increase monitonically from a limit on the left of zero to a limit on the right of one, since the probability of getting any very, very small number is close to zero, and the probability of getting any number smaller than a very large number is close to 100%. If we graph the integral of these four Cauchy distributions we get:
That graph is called the cumulative distribution and notice how it is extremely easy to read! Consider the purple line; clearly the probability of getting a value of two or less is about 85%; we can just read it right off. This graph has exactly the same information content as the "histogram limit" probability distribution; its just a bit easier to read. It is quite difficult to tell from reading the original graph that about 85% of the area under the curve is to the left of the 2.
Apropos of nothing in particular, I note that we have a function here that is monotone increasing; that means that we can invert it. Let's swap the x and y axes:
This function -- the inverse of the integral of the probability distribution -- is called the quantile function. It tell you "given a probability p from zero to one, what is the number x such that the probability of getting a number less than x is equal to p?" That graph should look familiar to anyone who has taken high school trig; the quantile function of the Cauchy distribution is simply the tangent function rejiggered to go from zero to one instead of -π / 2 to π / 2.
So that's pretty neat; the Cauchy bell-shaped curve is in fact just the derivative of the arctangent! But so what? How is this relevant?
We started this fabulous adventure by saying that sometimes you want to generate numbers that are random but not uniform. The graph above transforms uniformly-distributed random numbers into Cauchy-distributed random numbers. It is amazing, but true! Check it out:
private static Random random = new Random();
private static IEnumerable<double> UniformDistribution()
{
while (true) yield return random.NextDouble();
}
private static double CauchyQuantile(double p)
{
return Math.Tan(Math.PI * (p - 0.5));
}
private static int[] CreateHistogram(IEnumerable<double> data, int buckets, double min, double max)
{
int[] results = new int[buckets];
double multiplier = buckets / (max - min);
foreach (double datum in data)
{
double index = (datum - min) * multiplier;
if (0.0 <= index && index < buckets)
results[(int)index] += 1;
}
return results;
}
and now you can tie the whole thing together with:
var cauchy = from x in UniformDistribution() select CauchyQuantile(x);
int[] histogram = CreateHistogram(cauchy.Take(100000), 50, -5.0, 5.0);
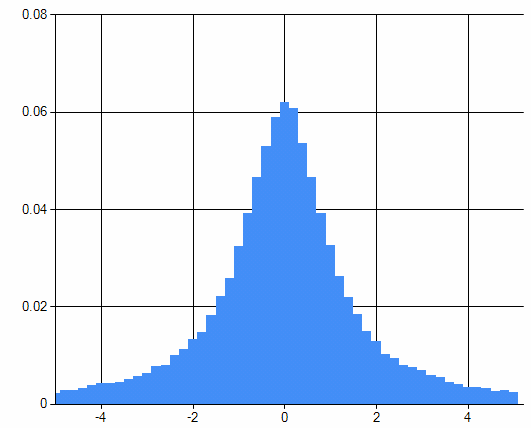
And if you graph the histogram, sure enough, you get a Cauchy distribution:
So, summing up: if you need random numbers that are distributed according to some distribution, all you have to do is
(1) work out the desired probability distribution function such that the area under a portion of the curve is equal to the probability of a value being randomly generated in that range, then
(2) integrate the probability distribution to determine the cumulative distribution, then
(3) invert the cumulative distribution to get the quantile function, then
(4) transform your uniformly distributed random data by running it through the quantile function,
and you're done. Piece of cake!
Next time: a simple puzzle based on an error I made while writing the code above.
(*) A commenter correctly points out that the set of real values representable by doubles is not uniformly distributed across the range of 0.0 to 1.0, and that moreover, the Random class is not documented as guaranteeing a uniform distribution. However, for most practical applications it is a reasonable approximation of a uniform distribution.
(**) Using the awesome Microsoft Chart Control, which now ships with the CLR. It was previously only available as a separate download.
Comments
Anonymous
February 20, 2012
"This graph has exactly the same information content as the "histogram limit" probability distribution; its just a bit easier to read." I don't get this comment, not in its current absolute form. Yes, if the information you're trying to get at is the probability of getting a value less than some given value, the integral graph is easier to read. But if the information you're trying to get at is the relative predominance of any given value, the original bell-curve graph is easier to read. That's the whole point of graphing/visualization. It reveals the data in ways that can be intuitively understood. But many types of data (including random samples) have a variety of interesting facets that are useful to understand. We select a type of graph of the data that best shows us the facet of interest. Each type of graph is only "easier to read" inasmuch as it fits the facet of interest. Pick a different facet, and a different type of graph is "easier to read". Claiming that the integral graph is easier to read than the bell-curve graph presupposes that what we care about is the cumulative distribution. If in the article we had started with that statement -- that we care about the cumulative distribution -- then the comment in question could have been made in a context-dependent way. But in its current form, with the absolute generalization, it seems prejudiced against bell-curve graphs. :(Anonymous
February 21, 2012
The comment has been removedAnonymous
February 21, 2012
That settles it - next time I'm in near Seattle, I'll definitely have to get you some of these: flowingdata.com/.../plush-statistical-distribution-pillowsAnonymous
February 21, 2012
The comment has been removedAnonymous
February 21, 2012
The comment has been removedAnonymous
February 21, 2012
The Microsoft Codename "Cloud Numerics" Lab (www.microsoft.com/.../numerics.aspx) has a good set of statistical functions for .NET including the inverse cumulative density function for many distributions. Despite the name, you don't have to run it in the cloud.Anonymous
February 21, 2012
I'm glad I can just #include <random> in C++11 now for all this. Is there not already something like a System.Numerics.Random namespace? Consider me surprised that C++'s anemic standard library has something the BCL doesn't if so.Anonymous
February 21, 2012
@Simon Personally I'd think anyone needing say a cauchy distribution, will almost certainly need some additional statistical libraries anyhow - and then these functions could easily be added there. It just doesn't seem like an especially "standard" thing to do. Now I'm certainly not against vast standard libraries, but only the c++ guys could add support for half a dozen different distributions, but still not include a XML parser.Anonymous
February 22, 2012
@voo: Not to get too far off topic, but unlike the BCL, the C++ standard is entirely maintained by volunteers. If you'd like to volunteer to specify an XML parser and represent your ideas at standard committee meetings for 5+ years to make sure it gets into the standard, please do so. Unfortunately, this time around, no one was willing to do that. There is an effort underway to build a much larger set of standard libraries for C++. Herb Sutter talked about this a bit in his Day 2 keynotes at the recent Going Native 2012 conference: channel9.msdn.com/.../C-11-VC-11-and-Beyond. Take a look at the video of his day 2 session.Anonymous
February 22, 2012
The comment has been removedAnonymous
February 24, 2012
I was surprised to hear you say that the .NET pseudo-random generator creates a unifrom distribution of doubles. Neither the Random.NextDouble() online documentation (msdn.microsoft.com/.../system.random.nextdouble.aspx), nor the intellisense comments make this guarantee. Since the valid values for a double type are not uniformly distributed, I saw no reason for Random.NextDouble() to be. If developers can rely on a uniform distribution, it would be nice for the documentation to reflect that.Anonymous
February 24, 2012
Cool, Thank you!!Anonymous
February 28, 2012
@Mashmagar The documentation for the constructor ofRandom(don't ask me why they put it there, instead of on the method itself) states: > The distribution of the generated numbers is uniform; each number is equally likely to be returned. But the documentation only describes what the implementers wanted to do. The actual implementation is so bad, that depending on what you do, you get significant biases.NextDouble has only 2 billion(2^31) different return values. There are around 2^53 (too lazy to look up the exact value, might be wrong by a factor of 2) different doubles in the interval between 0 and 1.
Next(maxValue) For some carefully chosen maxValues, it's very biased. For the full story, see my rant at stackoverflow.com/.../445517
Anonymous
March 22, 2012
@Code in Chaos: I did analyze the implementation. It is almost a correct implementation of an algorithm designed by Donald Knuth. (Actually Knuth's algorithm was a block-based algorithm, which was (correctly) converted to a stream random generator by the book Numerical Recipes in C (2nd Ed.) There is one mistake in the implementation which will drastically reduce the period of the RNG. They also threw away 56 more values than Knuth specifed for algorithm startup, but that is harmless. The alogithm proper returns an integer in the range [0,int.Maxval]. To get a Double they multipy it by 1/int.MaxVal. That creates a fairly reasonable approximation to a uniform double in the range [0,1]. The problem is how they generate integers. They literally do(int)(Sample()*maxValue)where Sample() is equivlent to NextDouble(). That is pretty obviously a terrible way to generate a random Integer, and is what results in most of the bias. Finally, the original implementation of Random was technically buggy, since NextDouble (and Next) were specified to return [0,1) and [0,maxValue) respectivly, but they actually returned [0,1] and [0,maxValue]. Note that the maxValue return for int only occured very rarely 1 in int.MaxValue times on average. However the way they fixed this bug results not only in additional bias, (although very slight), but also completely ruins the period of the generator. That was especially boneheaded, since there is a trivial change they could have made instead (requiring the addition of only 4 characters to the source code, not counting whitespace) that would cause neither bias nor damage to the generator's period.


