Using the Tasks Window (C#, Visual Basic, C++)
Applies to: ![]() Visual Studio
Visual Studio ![]() Visual Studio for Mac
Visual Studio for Mac
Note
This article applies to Visual Studio 2017. If you're looking for the latest Visual Studio documentation, see Visual Studio documentation. We recommend upgrading to the latest version of Visual Studio. Download it here
The Tasks window resembles the Threads window, except that it shows information about System.Threading.Tasks.Task, task_handle, or WinJS.Promise objects instead of each thread. Like threads, tasks represent asynchronous operations that can run concurrently; however, multiple tasks may run on the same thread.
In managed code, you can use the Tasks window when you work with System.Threading.Tasks.Task objects or with the await and async keywords (Await and Async in VisualBasic). For more information about tasks in managed code, see Parallel Programming.
In native code, you can use the Tasks window when you work with task groups, parallel algorithms, asynchronous agents, and lightweight tasks. For more information about tasks in native code, see Concurrency Runtime.
In JavaScript, you can use the Tasks window when you are working with promise .then code. See Asynchronous programming in JavaScript (UWP apps) for more information.
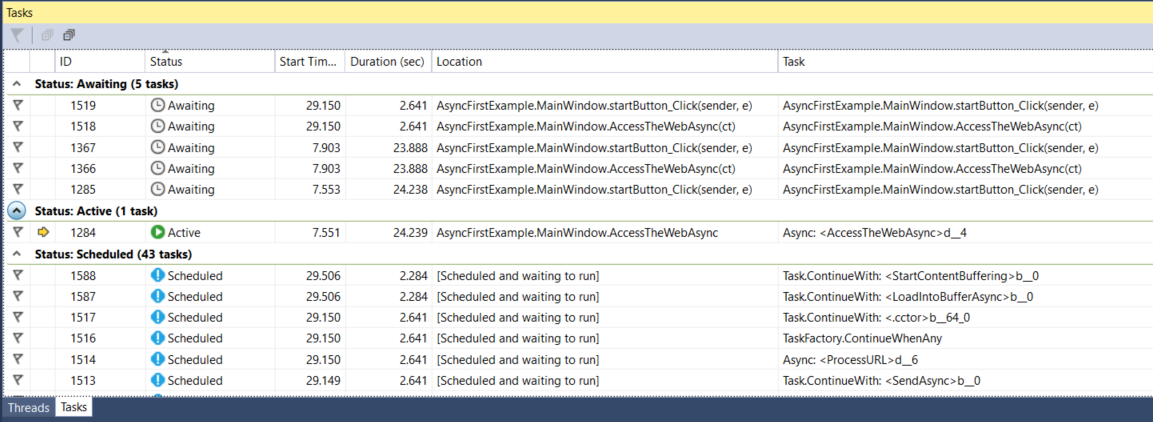
You can use the Tasks window whenever you break into the debugger. You can access it on the Debug menu by clicking Windows and then clicking Tasks. The following illustration shows the Tasks window in its default mode.

Note
In managed code, a Task that has a status of TaskStatus.Created, TaskStatus.WaitingForActivation, or TaskStatus.WaitingToRun might not be displayed in the Tasks window when managed threads are in a sleep or join state.
Tasks Column Information
The columns in the Tasks window show the following information.
| Column Name | Description |
|---|---|
| Flags | Shows which tasks are flagged and lets you flag or unflag a task. |
| Icons | A yellow arrow indicates the current task. The current task is the top-most task on the current thread. A white arrow indicates the breaking task, that is, the one that was current when the debugger was invoked. The pause icon indicates a task that has been frozen by the user. You can freeze and unfreeze a task by right-clicking it in the list. |
| ID | A system-provided number for the task. In native code, this is the address of the task. |
| Status | The current state (scheduled, active, blocked, deadlocked, awaiting, or completed) of the task. A scheduled task is one that has not yet been run and, therefore, does not yet have a call stack, assigned thread, or related information. A active task is one that was executing code before breaking in the debugger. An awaiting or blocked task is one that is blocked because it is waiting on an event to be signaled, a lock to be released, or another task to finish. A deadlocked task is a waiting task whose thread is deadlocked with another thread. Hover over the Status cell for a deadlocked or awaiting task to see more information about the block. Warning: The Tasks window reports deadlock only for a blocked task that uses a synchronization primitive that is supported by Wait Chain Traversal (WCT). For example, for a deadlocked Task object, which uses WCT, the debugger reports Awaiting-deadlocked. For a deadlocked task that is managed by the Concurrency Runtime, which does not use WCT, the debugger reports Waiting. For more information about WCT, see Wait Chain Traversal. |
| Start Time | The time at which the task became active. |
| Duration | The number of seconds that the task has been active. |
| Completion Time | The time at which the task completed. |
| Location | The current location in the call stack of the task. Hover over this cell to see the entire call stack for the task. Scheduled tasks do not have a value in this column. |
| Task | The initial method and any arguments that were passed to the task when it was created. |
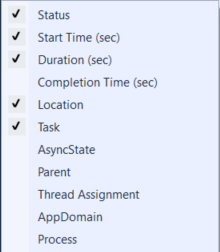
| AsyncState | For managed code, the task status. By default, this column is hidden. To display this column, open the context menu for one of the column headers. Choose Columns, AsyncState. |
| Parent | The ID of the task that created this task. If this is blank, the task has no parent. This is only applicable for managed programs. |
| Thread Assignment | The ID and name of the thread on which the task is running. |
| AppDomain | For managed code, the application domain in which the task is executing. |
| task_group | For native code, the address of the task_group object that scheduled the task. For asynchronous agents and lightweight tasks, this column is set to 0. |
| Process | The ID of the process that the task is running on. |
You can add columns to the view by right-clicking a column heading and then selecting the columns you want. (Remove columns by clearing the selections.) You can also reorder columns by dragging them left or right. The column shortcut menu is shown in the following illustration.

Sorting Tasks
To sort tasks by column criteria, click the column header. For example, by clicking the ID column header, you can sort the tasks by task ID: 1,2,3,4,5 and so on. To reverse the sort order, click the column header again. The current sort column and sort order is indicated by an arrow on the column.
Grouping Tasks
You can group tasks based on any column in the list view. For example, by right-clicking the Status column header and then clicking Group by > [status], you can group all tasks that have the same status. For example, you could quickly see awaiting tasks so that you could focus on why they are blocked. You can also collapse a group that is not of interest during the debug session. In the same manner, you can group by the other columns. A group can be (un)flagged just by clicking the button next to the group header. The following illustration shows the Tasks window in grouped mode.

Parent Child View
(This view is available for managed code only.) By right-clicking the Status column header and then clicking Group by > Parent, you can change the list of tasks to a hierarchical view, in which every child task is a sub-node that can be displayed or hidden under its parent.
Flagging Tasks
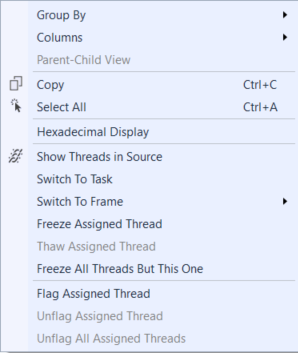
You can flag the thread the task on which a task is running by selecting the task list item and then choosing Flag Assigned Thread from the context menu, or by clicking the flag icon in the first column. If you flag several tasks, you can then sort on the flag column to bring all the flagged tasks to the top so that you can focus just on them. You can also use the Parallel Stacks window to view only flagged tasks. This lets you filter out tasks that you are not interested in for debugging. Flags are not persisted between debugging sessions.
Freezing and Thawing Tasks
You can freeze the thread on which a task is running by right-clicking the task list item and then clicking Freeze Assigned Thread. (If a task is already frozen, the command is Thaw Assigned Thread.) When you freeze a thread, that thread will not execute when you step through code after the current breakpoint. The Freeze All Threads But This One command freezes all threads except the one that is executing the task list item.
The following illustration shows the other menu items for each task.

Switching the Active Task or Frame
The Switch to Task command makes the current task the active task. The Switch to Frame command makes the selected stack frame the active stack frame. The debugger context switches to the current task or the selected stack frame.