Dashboard entities
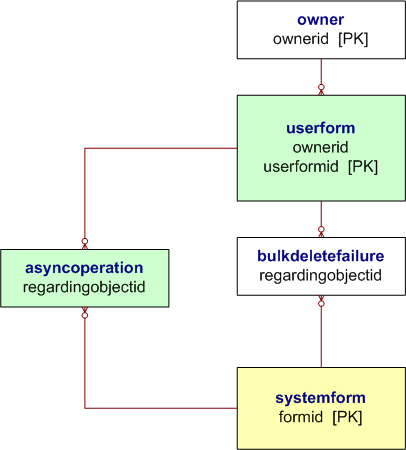
The dashboard entities enable you to simultaneously present data from up to six charts, grids, or IFRAMES. The following illustration shows the entity relationships for this area. More information: Key to Entity Diagrams

Этот браузер больше не поддерживается.
Выполните обновление до Microsoft Edge, чтобы воспользоваться новейшими функциями, обновлениями для системы безопасности и технической поддержкой.
The dashboard entities enable you to simultaneously present data from up to six charts, grids, or IFRAMES. The following illustration shows the entity relationships for this area. More information: Key to Entity Diagrams
