Troubleshooting Performance Issues in Web Application
There are many options to troubleshoot performance issues in .NET Web Application. We can use ETW, performance logs, IIS logs, application logs, dumps and profiler. Today I am going to show how to use NP .NET Profiler to troubleshoot performance issues. You can download the tool from here
Introduction
.NET CLR runtime provides notification about a variety of events that occur within the .NET application. With the help of these events a .NET Profiler can analyze the performance of .NET application. These events are notified to the profiler via ICorProfilerCallback interface. This interface consist of methods such as FunctionEnter, FunctionLeave, ObjectAllocated, ExceptionThrown,etc. With the help of these events profilers can calculate which functions took long time to execution time, number of exceptions it raised, amount of memory it allocated etc. Click here for more details on profiling API
NP .NET Profiler implements this ICorProfilerCallback profiling interface to profile .NET applications. NP .NET Profiler supports all versions of .NET Runtime on all Windows Operating Systems. It also supports virtual machines.
NP .NET Profiler is designed to assist in troubleshooting performance, memory and first chance exception issues in the following applications:
- .NET Web Applications
- WCF Applications
- .NET Windows Services
- WPF Applications
- .NET Console Applications
- .NET COM Applications
- Windows Azure Applications
- Silverlight Applications
Advantages of NP .NET Profiler
- XCopy deployable
- No need to install or reboot the machine
- No need to recompile the application code
- On Closing
- Nothing left running on the machine
- Very minimum overhead
- Namespace based filters and time based filters during data collection, this reduces the amount of logs captured
- Output files are saved in binary format
- Generates detailed reports
- Generates callstack for each and every individual instance of a function
- Collects CPU consumption per individual instance of a function
Steps to collect profiler logs
NP .NET Profiler UI is wizard based. Just follow the wizard...
- Extract the NP.zip file to c:\temp\np folder
- Launch NP .NET Profiler by double clicking on NP.exe
- Click on "New Profiler Run" button on the top left
- Select "Start a New Project" and click Next button
- Select ".NET 4.0 Framework" and ".NET Web Application"
- Click Next button
- Select AppPool and click Next button
- Only this selected AppPool will be profiled
- If the AppPool list is empty, type in the AppPool name
- Select "Troubleshoot Performance Issues" and click Next button
- Select "Namespace based filter" and click Next button
- Select "Ignore System and Microsoft namespaces" and click Next button
- Click Next button
- Click "Start Profiling" button
- When prompted to restart IIS, click yes
- Launch the web application and reproduce the performance issues
Reviewing profiler logs
.NET Profiler generated huge number of reports. Here are the reports from a sample MVC Web Application. The problem statement for this test application is: one of the request is taking more than 10 seconds to execute.
- Once the test is completed, click on the "Stop Profiling" button in the NP.exe
- When prompted to restart IIS, click yes
- This will restart IIS so that AppPool restarts without the profiler options
- Click on "Show Reports" button
- If NP.exe is closed, launch it again and click on "Open Existing output file"
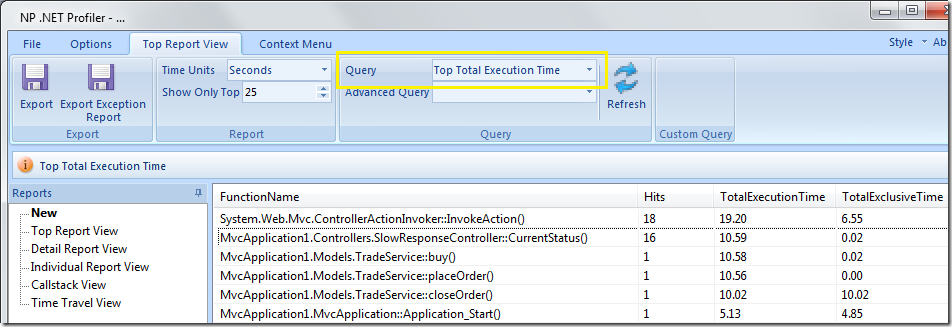
- By default, NP .NET Profiler will display the Total Execution Time report as shown :

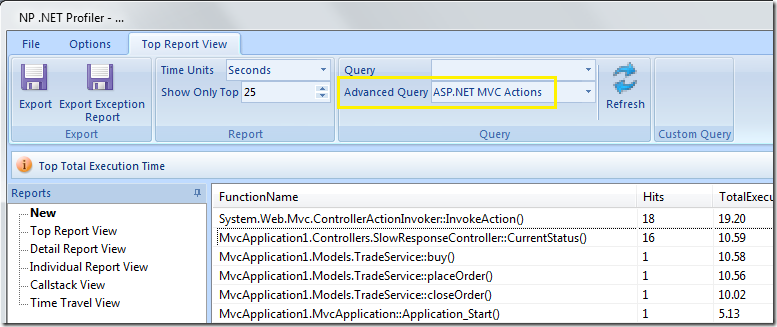
- Select "ASP.NET MVC Actions" in the "Advanced Query" combo box and click Refresh button as shown :

- “ASP.NET MVC Actions” query shows the list of MVC requests that got executed during the profiler run. The list is sorted by Total Execution Time.

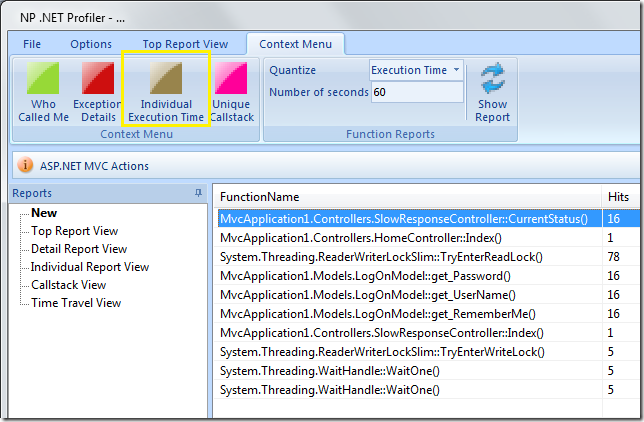
- Select the top function and click on the "Individual Execution Time" button as shown :

- This will show individual instances of function. In my test, there are around 16 instances of this function. One of these instances’ execution time is around 10 seconds
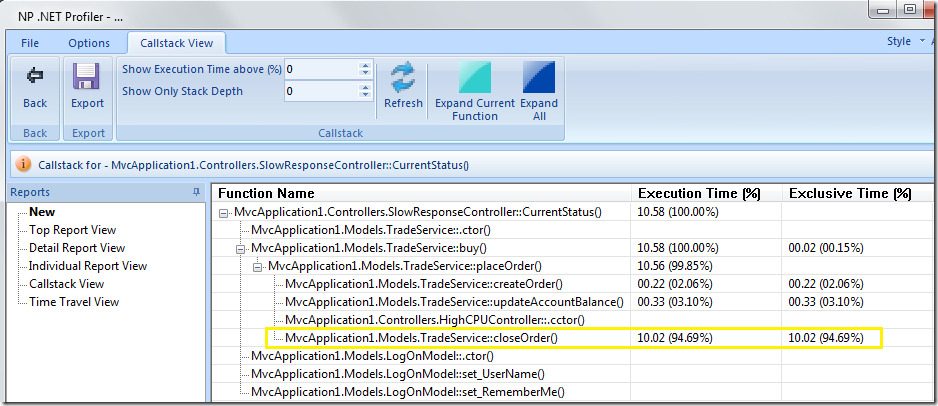
- To review the callstack, select a instance of the function and click on the "Show Callstack" button as shown :

- Expand the tree nodes
- Review the "Exclusive Time" column
- Notice one of the subfunction takes more time to execute

Comments
Anonymous
October 04, 2012
I work in Prashant's team at Microsoft and this tool has helped me (and all other colleagues) so much that it is difficult to convey in a comment. If the problem is reproducible at will, this tool can help identify the problem in a very short time. I highly recommend this tool.Anonymous
December 17, 2012
Could someone please explain what the acronym NP stands for?Anonymous
December 18, 2012
NP stands for .NET Profiler :) Initially it was just a small exe (np.exe) to profile console applications. We gradually added features to profiler other applications.Anonymous
March 04, 2013
hi, i'm a fresher working on .net platform...... i'm facing an issue. if i run the web application the web page is not loading. but this didn't not happened earlier. i did every possible try but no results. I have created a new website application in visual studio, even this is also not loading. i dont know wat is the issue....can anyone please kindly suggest me the solution. thanks in advanceAnonymous
March 05, 2013
please share your Visual Studio solution (upload it to SkyDrive)Anonymous
April 25, 2016
While trying to profile a Windows Forms application, the Profiler does not generate any profiler logs:http://social.Msdn.microsoft.com/Forums/en-US/csharpgeneral/thread/a5d04970-480c-4bd6-9760-67421888135f#02eb09d6-f10b-4763-9c87-cf09181f8805Could you fix this bug and always output an error message if the logs couldn't be generated?