Launching Windows Store App under a Debugger
We recently released a .NET Profiler tool for troubleshooting Windows Store Applications on Windows 8 machines. You can download this tool from here. In this blog post, we will talk about how to launch a Windows Store Application under a debugger.
For regular windows applications, we can launch it from a debugger using File -> Open Executable. But the Windows Store Apps must be launched by other process (something similar to Windows NT Services). How can you attach a debugger at startup ?
We can use NP .NET Profiler tool to attach the debugger at startup. Here are the steps :
- Download the tool from here
- Extract the NPStoreApp.zip to c:\temp\np folder
- Double click on NPStoreApp.exe
- Select the Windows Store Application from the list box
- Set the “Profiler Type” to “Run under Debugger (without the profiler)”
- In the “Profiler Option” enable “Run under Debugger” and browse to your favorite debugger
- Now, click on the “Start Profiling” button
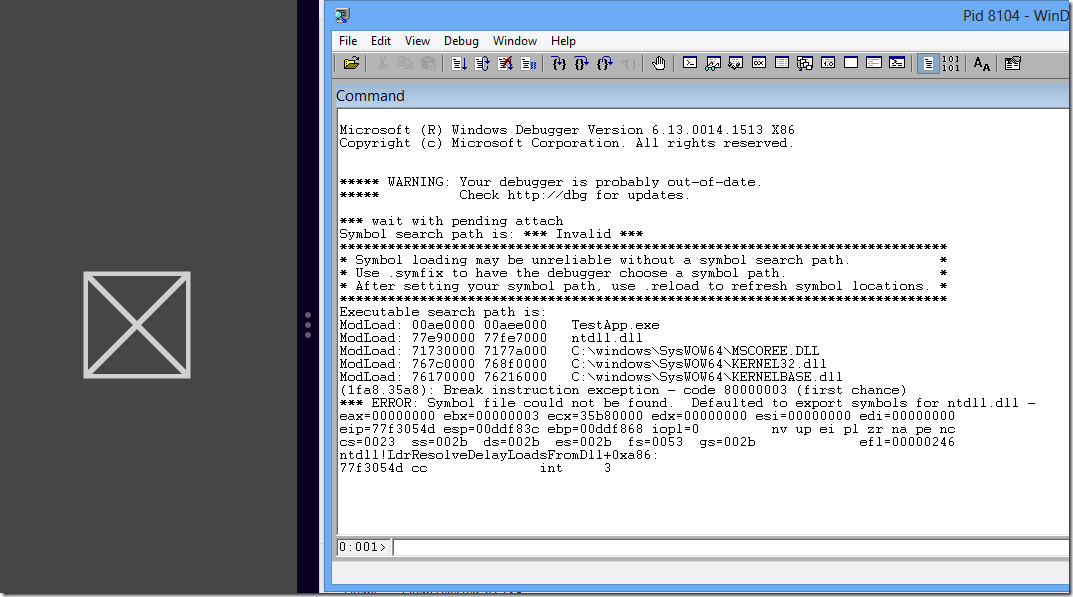
- This will launch the Windows Store App under the debugger. The Windows Store App will be paused until we hit the g in the debugger as shown below in the second image. Debugger will be launched in the Desktop and the app will be launched in the modern UI
- Running under debugger disables process suspension/resumption
Click the image for a larger view
Comments
- Anonymous
January 16, 2013
I failed to run my app with the debugger: exception is IdentityNotMappedException.

