Beginner's Guide to Profiling Parallel Apps Part III
Hello and welcome to the third installment of the "beginner's guide" series. While I discussed the "CPU Utilization" view last time, I will now discuss the "Threads" view in the profiler.
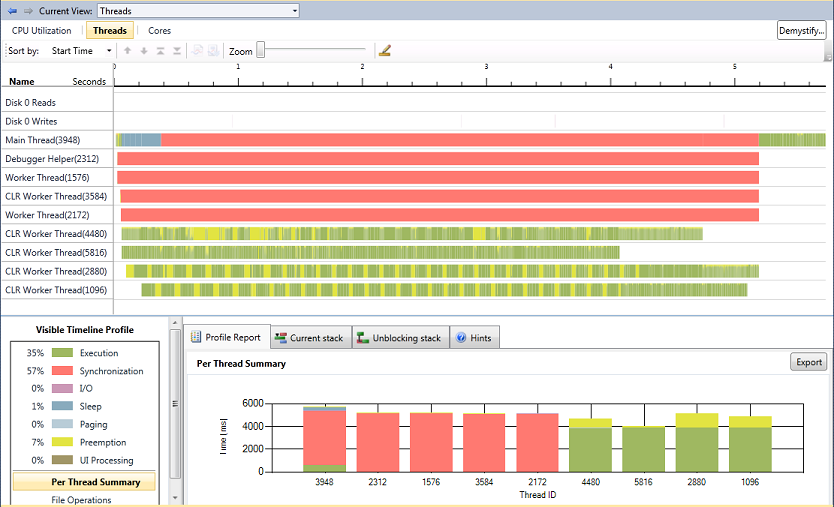
Working with the same code as in my last post, I will now re-examine the performance from a different perspective. I will take a look at each thread's execution history. Launching the performance wizard the same way as before, I now navigate to the "Threads" view to find this:

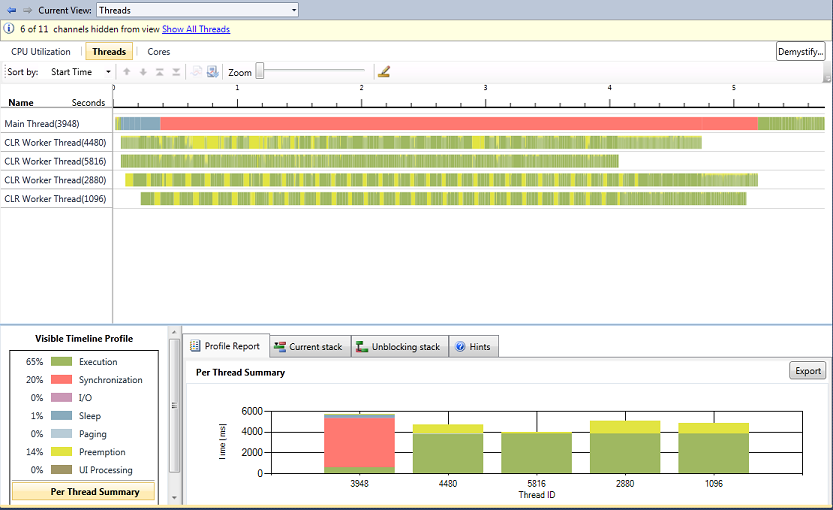
Each horizontal line represents either an "I/O Channel" or a thread. In this case, the top two represent I/O channels while the rest represent threads. The left column labels each thread by name and thread id. There are nine threads represented on this chart (along with two I/O channels). I am interested only in the main thread and the last four worker threads, which I spawned to do all the busy work. I would therefore like to remove the unimportant threads (and the I/O channels) from view. I can hide threads from view by right-clicking and selecting "hide". After removing from view all uninteresting threads, I am left with this:

Now, to make this clear, this chart shows the state of each thread throughout the lifetime of its execution with time increasing along the x-axis. Upon examining the Visible Timeline Profile, I can see that since the main thread is mostly red, it is spending the majority of its time synchronizing. I can also see that the four worker threads are mostly spent on execution. This makes sense when considering that I wrote my application such that the main thread spawns four worker threads to do all of the computation. Meanwhile, the main thread simply waits for them to finish via a "join" call. While we're on the subject of the Visible Timeline Profile, I'd also like to point out that the statistics associated with each thread state are now updated since I hid the other threads. They will also update when you pan or zoom in and out. These updated statistics, which reflect all unhidden threads in the visible time range, can become much more meaningful when you hide or zoom to isolate specific areas of interest.
It's also apparent that the four threads eventually finish executing and disappear from the chart. At the moment that the last worker thread finishes, the main thread resumes control.
It is also worth noting that the main thread sleeps (colored blue) briefly. This mostly results from the way the OS and CLR handle thread creation and scheduling, which is beyond the scope of this post.
From this view, it is clear that multiple threads are executing concurrently but despite having an identical work-load, we can see that they don't all finish at the same time. I suspect this results from the visible preemption from other processes, colored yellow (likely my browser, Outlook, and others). Different amounts of preemption for each thread causes them to finish at different times.
There is much more to talk about here but in the interest of keeping this post relatively short, I'll leave the rest for you to discover (go download beta 2 and try it out for yourself!). Once again, the Concurrency Visualizer has painted a very informative and accurate picture of my app's multithreaded behavior!
James Rapp - Parallel Computing Platform