Developers Choice: Query progress - anytime, anywhere
Edit (4/23/2018): due to a possible random AV running your favorite monitoring stored procedure, please make sure you install KB 4078596 in your SQL Server 2016 and SQL Server 2017.
Edit (9/24/2018): this feature is now enabled by default in SQL Server 2019. Trace flag not needed anymore! Also, new query hint query_plan_profile to enable lightweight profiling at the query level, for any session, in SQL Server 2019, 2017 CU11 and 2016 SP2 CU3.
One of the most important actions when a performance issue hits, is to get precise understanding on the workload that’s executing and how resource usage is being driven. The actual execution plan is an invaluable tool for this purpose.
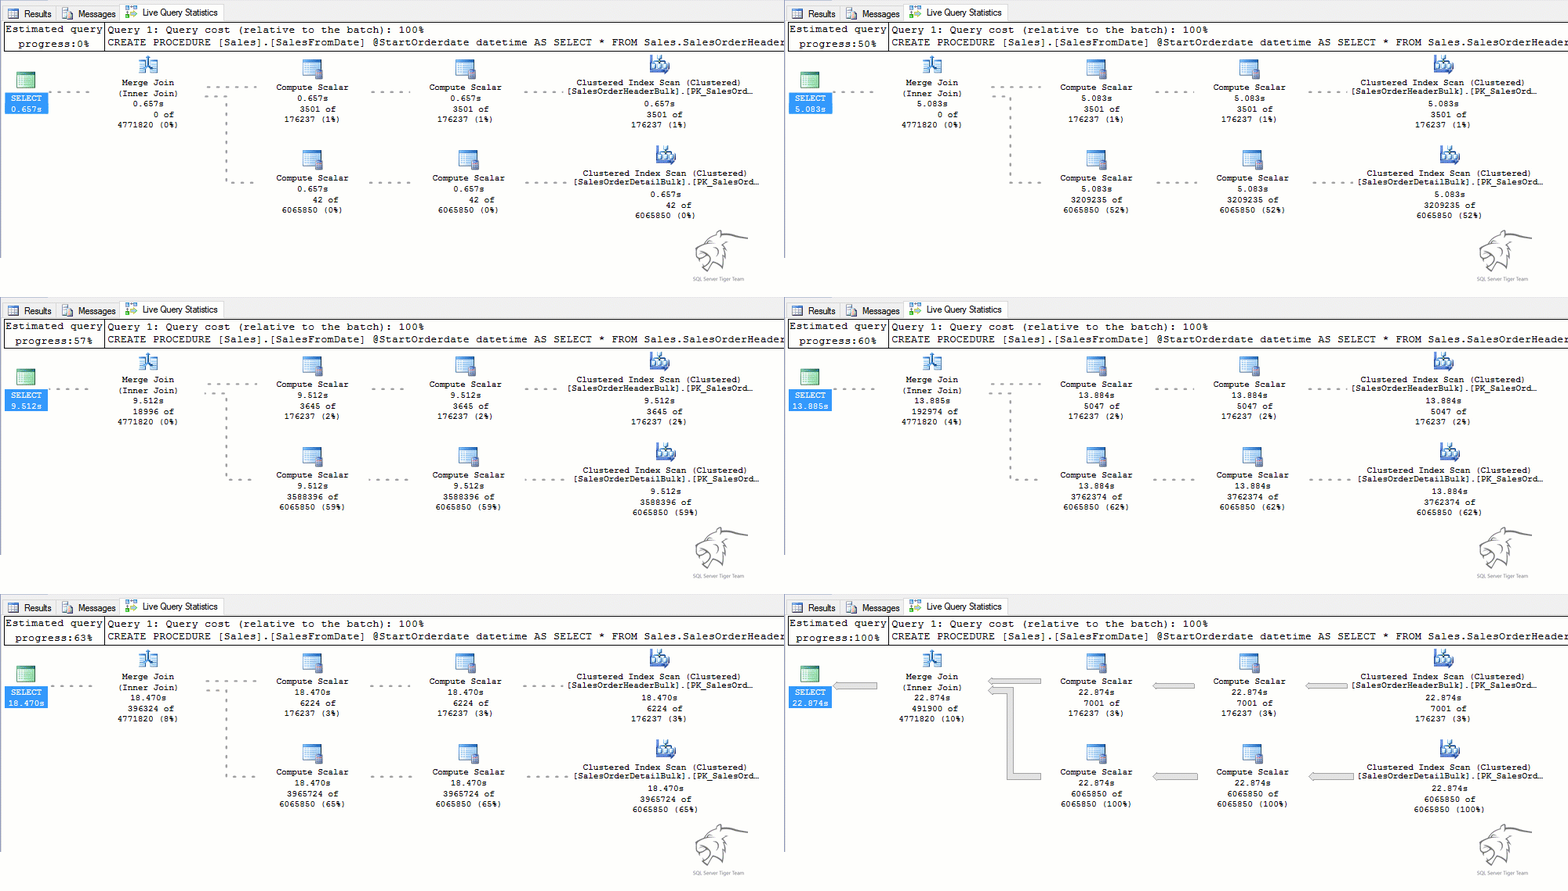
Query completion is a prerequisite for the availability of an actual query plan, but with LQS (Live Query Statistics), you can already get information about in-flight query executions (see this blog post), which is especially useful for long running queries, and queries that run indefinitely and never finish.
Up to SQL Server 2016 RTM
To look at in-flight query executions, the query execution statistics profile infrastructure must be enabled on demand (later in this post referred to as Legacy).
The query execution statistics profile infrastructure can be enabled for a target session:
- Clicking on Include Live Query Statistics in SSMS, starting with SQL Server 2014.
- SET STATISTICS XML ON
- SET STATISTICS PROFILE ON
Or globally, to view LQS for all sessions (such as from Activity Monitor), by enabling the query_post_execution_showplan (starting with SQL Server 2014).
But enabling this event can take a big performance toll in your production server, and so probably you are not running with it continuously, even if it gives you the ability to tap into any running executions, and query plans with execution statistics.
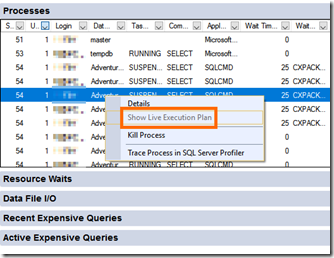
With SQL Server 2016 and SQL Server 2014 SP2, we managed to considerably bring down the performance toll of running this xEvent (see table below, middle row), and also introduced the query_thread_profile extended event. This also enables LQS for all sessions, using Activity Monitor or directly querying sys.dm_exec_query_profiles.
Enters SQL Server 2016 SP1
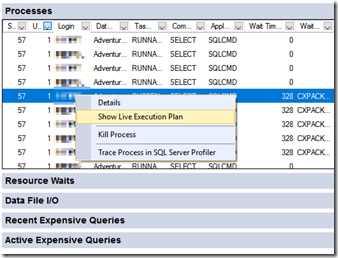
Now with SQL Server 2016 SP1, we are introducing a real lightweight query execution statistics profiling infrastructure, to dramatically reduce performance overhead of collecting per-operator query execution statistics, such as actual number of rows. This feature can be enabled either using global startup trace flag 7412 , or is automatically turned on when query_thread_profile xEvent is enabled. Again, this also enables LQS for all sessions, using Activity Monitor or directly querying sys.dm_exec_query_profiles.
How much lightweight you ask?
We ran a TPC-C like workload in both the legacy and lightweight profiling infrastructures, and this is what we found:
So you can see above that enabling the new lightweight profiling infrastructure (with the trace flag 7412) has a max overhead of 2 percent, as opposed to 75 percent before SQL Server 2014 SP2/2016 RTM. This means that now, for any server that is not already resource bound, you can run the lightweight profiling infrastructure continuously, and tap into any running execution at any time using for example Activity Monitor or directly querying sys.dm_exec_query_profiles, and get the query plan with execution statistics.
The possibilities this unlocks for performance troubleshooting in production environments are tremendous, and if your servers are not already resource bound, we encourage you to enable this trace flag for the potential it unlocks. As usual, we recommend you test this in a pre-production environment to estimate your specific impact beforehand.
When the lightweight profiling is enabled, the information in sys.dm_exec_query_profiles (and so LQS) is available via the new profiling infrastructure instead of the legacy profiling infrastructure.
Examples
Here's a few usage examples:
- Clicking on Include Live Query Statistics in SSMS uses the legacy profiling infrastructure starting with SQL Server 2014 RTM, but with SQL Server 2014 SP2 and SQL Server 2016, doing the same uses an earlier version of the lightweight profiling infrastructure. In SQL Server 2016 SP1, and only by setting TF 7412 or using query_thread_profile xEvent, you can then click on Include Live Query Statistics and use the new lightweight profiling infrastructure. Starting with SQL Server 2016 SP2CU3 and SQL Server 2017 CU11, the new query hint query_plan_profile can be used to enable lightweight profiling at the query level, for any session.

- SET STATISTICS XML ON, SET STATISTICS PROFILE ON and query_post_execution_showplan xEvent always use the legacy profiling infrastructure.
There’s also the new DMF sys.dm_exec_query_statistics_xml, which returns the query execution plan for in-flight requests. For example, you can now use this DMF to get the plan for a query while it is running, and works under both legacy and lightweight profiling infrastructure.
Use this DMV to retrieve the showplan XML with transient statistics, as seen below:
And you can join with other DMVs like sys.dm_exec_requests. The Running-Blocked-Processes script in the TigerToolbox Github is already using this to access the “live_query_plan_snapshot”, among other useful data.
In summary
If your SQL Server is not already CPU bound and a 1.5% to 2% overhead is negligible for your workloads, we recommend you enable TF 7412 as a startup trace flag, and unleash the power of live query troubleshooting in production environments.
Pedro Lopes (@sqlpto) – Senior Program Manager
Comments
- Anonymous
December 02, 2016
Super!! - Anonymous
December 04, 2016
Thanks for getting this to a state which can be run for a longer period of time. It's not always the case that the first thing that shows up.in watched queries is the first/worst query at the top of the pareto chart of problematic queries. Also, this will help to determine what's burning resources at "runtime" instead of having to wait until the query is finished. - Anonymous
December 05, 2016
Great feature! Thanks for sharing. - Anonymous
December 06, 2016
This is fantastic. We're very glad the team is investing in this, and look forward to trying it out in our dev environment soon. Thank you! - Anonymous
December 28, 2016
Are the build versions correct for this trace flag? I've been unsuccessfully trying to get this to work in a test environment.I used DBCC TRACESTATUS to confirm that the trace flag is on on the instance, however the live query statistics option is still grayed out in activity monitor. I tried SQL 2014 SP2. I also tried installing CU2 for SP2 with no success.I tried SQL 2016 RTM as well, which did not work either. I was able to get this to work after installing SP1 for SQL 2016. However, I still have not gotten it to work successfully on any build of SQL 2014.I also noticed that sys.dm_exec_query_statistics_xml does not exist on any version that I tried with the exception of SQL 2016 SP1.- Anonymous
December 28, 2016
Hello, in previous SQL Server versions and builds you can enable the legacy profiling infra by using SET STATISTICS XML ON or SET STATISTICS PROFILE ON - that's been available for years. From SQL Server 2014 RTM until SQL Server 2014 SP2, the legacy profiling infra can also be enabled by clicking on Include Live Query Statistics in SSMS or using the query_post_execution_showplan xEvent. Starting with SQL Server 2014 SP2 and 2016 RTM you can enable a form of the lightweight profiling infra (see table in the post) by using the query_thread_profile or query_post_execution_showplan xEvents, or by clicking on Include Live Query Statistics in SSMS.In SQL Server 2016 SP1, we introduced the full-fledged lightweight profiling infra. This can be enabled by using TF 7412, or using the query_thread_profile xEvent.I've attempted to clarify this in the post (look under "usage examples").Thanks for the feedback!- Anonymous
January 04, 2017
The comment has been removed
- Anonymous
- Anonymous
- Anonymous
January 05, 2017
We noticed that when using lightweight profiling on SQL 2016 SP1 (either via trace flag 7412 or query_thread_profile), the following columns in sys.dm_exec_query_profiles incorrectly report 0 regardless of how much work the query has done thus far: first_active_time, last_active_time, open_time, first_row_time, last_row_time, close_time, elapsed_time_ms, cpu_time_ms.Should we file a Connect issue? Or is this a known sacrifice that had to be made in order to keep the overhead down? If so, it would be good to note the limitations in the documentation (https://msdn.microsoft.com/en-us/library/dn223301.aspx).We heavily use the cpu_time_ms column in particular, so it would be very helpful to have that information available via lightweight profiling.- Anonymous
January 05, 2017
Hello Geoff, that is correct. The CPU and elapsed times are not supported in lightweight profiling to reduce the performance impact to a minimum. I'll be adding that note to BOL.Thanks!- Anonymous
January 06, 2017
The comment has been removed
- Anonymous
- Anonymous
- Anonymous
January 11, 2019
The comment has been removed- Anonymous
January 14, 2019
Hi,I'm sorry if this wasn't clear to you. As shown in the graph, the standard profiling infra has an overhead of 75%+, whereas the lightweight profiling infra reduces that to about 2%. Enabling 7412 means that overhead is always present (which should be negligible for most workloads) but the trade-off is live query troubleshooting 24x7.I also suggest going through the doc s here: https://docs.microsoft.com/en-us/sql/relational-databases/performance/query-profiling-infrastructure
- Anonymous


