SQL Server Resource Governor Monitoring reports
Resource Governor is an extremely cool and powerful feature that, when implemented, can manage the consumption of CPU and memory resources. I will not be going into the details of Resource Governor, or even how to set it up as this is extensively documented in Books Online. What I will be talking about today is a tool, in particular a report, that I’ve developed to monitor the current state of Resource Governor usage and the current activity that is taking place.
The challenge I’m looking to tackle here today is a solution in order to visualize what is currently happening with resource consumption. I have written an SSRS report (well, actually two reports, but logically it can be considered one monitoring solution) to show this data. The reason I chose to write an SSRS report is because I wanted the ability to bring it into SQL Server Management Studio as a custom report. As SQL Server DBAs, SSMS is our go-to tool of choice.
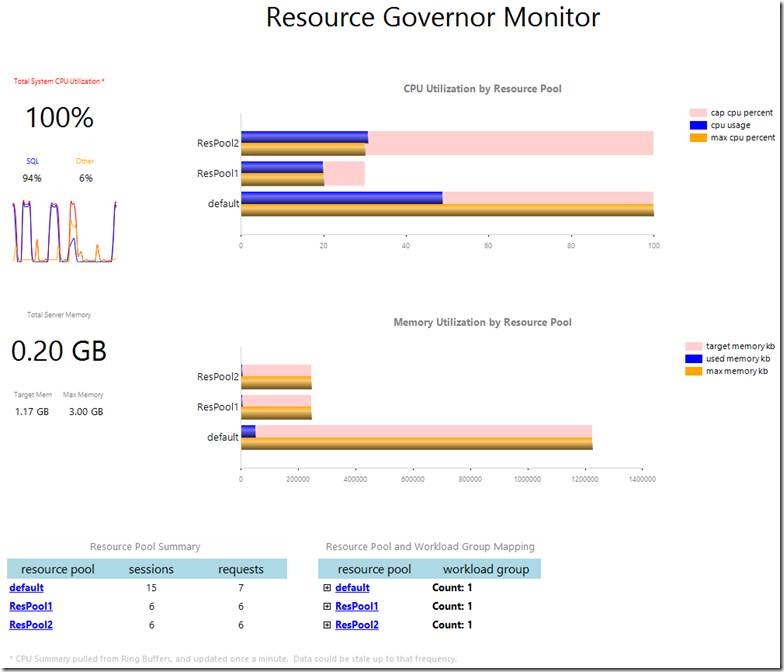
I designed the report to have an overview breakdown of CPU and memory utilization, and then by each particular resource pool in their respective category. The all-encompassing screenshot can be seen below:
CPU Breakdown
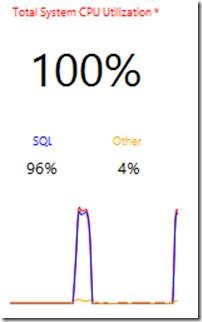
In the main screenshot, focus on the top row of data. This is the CPU monitoring portion of the report. On the left hand side you can see the system CPU summary:
This rectangle has a bit of information, including three CPU metrics: Total System CPU utilization, SQL Server process CPU utilization, and other process CPU utilization. Then right below this there is a little sparkline graph to visually show the past hour of this data. One thing to note here is that all of these numbers are pulled from the ring buffers, and this data is only refreshed once a minute (for more information on this please see Amit Banerjee’s blog post on the topic). So this data can be up to 60 seconds stale, and if your CPU utilization for each resource pool (real-time) doesn’t make sense compared to this CPU summary rectangle (refreshed every 60 seconds) then it is because of this update schedule for the ring buffers.
Right next to this CPU summary rectangle is a breakdown of current CPU utilization by resource pool:
There are three interesting metrics plotted here for each resource pool (named on the y-axis): cap CPU percent (only available in SQL Server 2012 and the corresponding Resource Governor Monitor report), CPU usage, and max CPU percent. The cap CPU percent and the max CPU percent are configuration values for the pool, and CPU usage is the currently amount of CPU that the particular resource pool is consuming.
Memory Usage
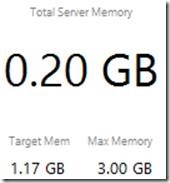
Right below the CPU utilization numbers, we see the horizontal display of memory utilization. The structure is the same as CPU, with the summary on the left:
This summary gives us three high-level memory metrics: Total Server Memory, Target Server Memory, and max server memory. To the right is the memory consumption breakdown by resource pool:
There are three plotted metrics for each resource pool: max memory, target memory, and currently used memory.
Activity and Configuration Summary
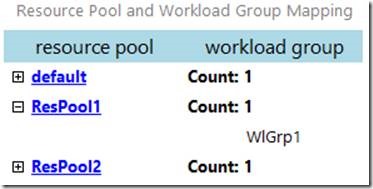
I also wanted to have enough information on this semi-dashboard to minimize the need to go to diagnostic queries. Connecting the dots is really what it’s all about, and I thought it prudent to have a mapping of workload groups to resource pools in this report:
Oftentimes we see a 1:1 relationship between resource pools and workload groups, but if you introduce a one to many relationship then it could get relatively confusing. You see CPU and memory consumption, but you may want to know right off the bat which workload group(s) are consuming that particular resource pool.
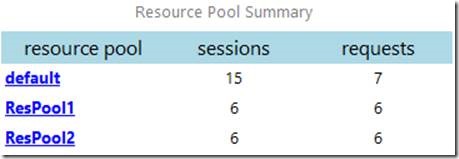
I put the count of sessions related to each pool, and also the current count of executing requests:
This will give you an idea of session/request distribution across the resource pools. And if you want a more detailed look at current requests, just click the resource pool name (drill through), and you’ll get routed to another report showing current activity for that particular resource pool:
This report parameterized by resource pool and grouped by workload group, and when you expand a workload group you will see a list of current requests as well as their CPU time, reads, granted query memory, and the corresponding SQL text.
Next Steps
If you want to start using this report today, follow the below steps:
2. Unzip the RDL files in your SSMS Custom Reports directory
a. Example: C:\Users\YourUserName\Documents\SQL Server Management Studio\Custom Reports
3. Open up SQL Server Management Studio
4. Maximize the Management tab in Object Explorer
5. Right-click on Resource Governor
6. Mouse-over Reports and select Custom Reports…
7. Select the Resource Governor Monitor [2012 | 2008].rdl report
Now that you’ve selected the proper report, it’ll appear in the Reports menu of SSMS under Resource Governor for future easy access:
This will be a living and maturing report, so if you have something you want to see included in this report regarding Resource Governor monitoring, please leave a comment below and it will be considered and possible added. Enjoy!
Thomas Stringer - SQL Server Premier Field Engineer
Twitter: @SQLife
Comments
Anonymous
June 20, 2013
Thanks for this, will come in handyAnonymous
June 20, 2013
My pleasure, I hope it does prove helpful.Anonymous
June 23, 2013
Cool... Thank you!Anonymous
July 09, 2013
The comment has been removedAnonymous
July 09, 2013
Sven, what version of SSMS are you using? This can be retrieved from the "Help" menu section, and the "About" item.Anonymous
July 24, 2013
hi, i got the same error as Sven. My SSMS version is 10.50.2500.0.Anonymous
October 18, 2013
same in my environment sql 2008 (r1) sp3. it doesn not happen in R2Anonymous
November 22, 2013
this helps a lot. Thank you.Anonymous
April 11, 2014
Hi, Would it be possible to make the table on the first page bigger? We're currently using approx. 10-12 resource pools and only 5 names of them appear to the left of the table, whilst it is also not very clear which lines belong to the those 5. Thanks!Anonymous
October 22, 2016
Hi Thomas,Great contribution for the SQL community - Appreciate it !I tried it on SQL Server 2016 with dedicated resource pool for In-Memory objects and it worked like charm ! Thank you.Br,Anil
