VSTS 2010 Feature: Load Testing Run Comparison Report in Excel
This blog post is going to be about one of my favorite new features added for Beta2. In Beta1 we added excel integration for reporting on Load Test Reports. In beta1, the report that was added was a trend report which would give you a feel for how certain counters changed from run to run. Check out this blog post for more info on that report: Excel Trend Report
The new report type which has been added gives a more detailed comparison of 2 runs. Let’s walk through creating the new report and looking at the output.
1) Launch Excel and click on the load test ribbon. The click the Load Test Report Button.
2) In the first page of the wizard enter the database server and select the database. Then click next.
3) On second page of the wizard choose “Create a Report” and click Next.
4) On third page, select Run Comparison as the report type. Then click next.
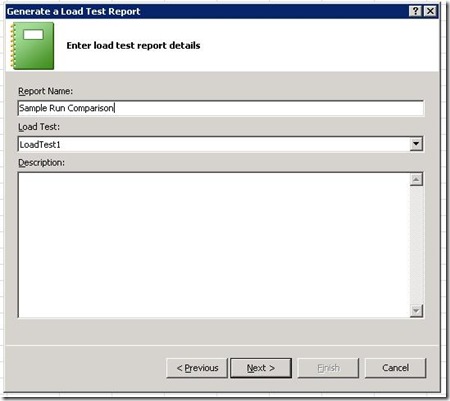
5) On fourth page, Enter a name for the report and choose a load test that you want to use for report generation. Click next.
6) The fifth page is where you select the runs to compare. Select 2 runs and click next.
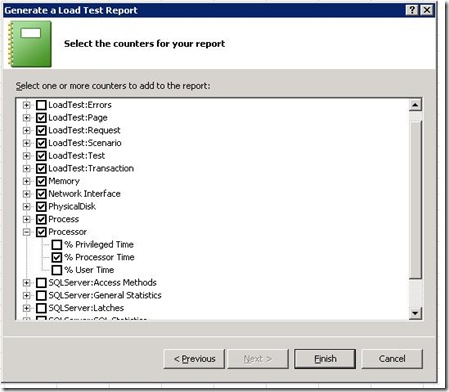
7) The sixth page is where you select the counters that you want included on the report. You will notice that there are some counters which have been pre-selected. These are just some default counters. Select whichever counters you want.
8) Then click finish and the report will be generated.
Now let’s take a look at what was generated for you.
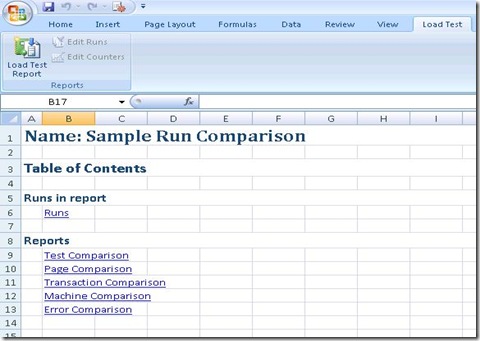
1) Table of Contents – This page gives you a list and links to each page in the report.
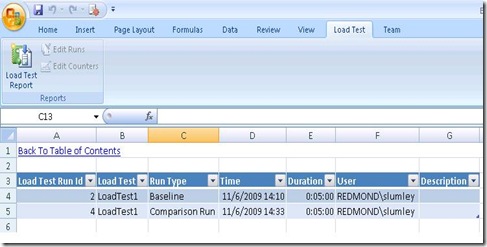
2) Runs – This page gives a little info about the 2 runs which were selected.
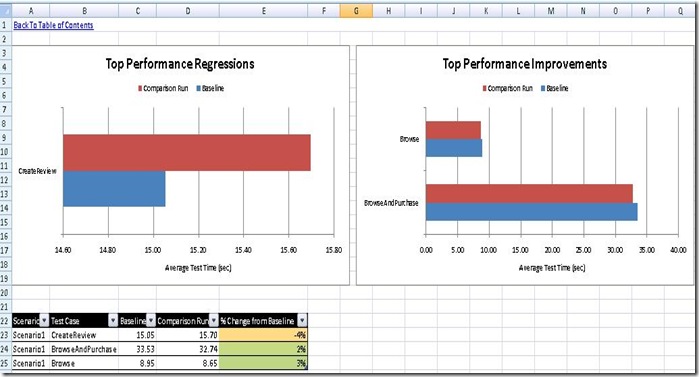
3) The next three sheets give a comparison of each test, page and transaction in the load test.
4) Test Comparison – The page and transaction sheets will be very similar to this. The 2 charts at the top will show the top 5 tests which had the largest performance improvement and top 5 tests which showed the worst regressions. The table underneath the chart will show all tests in the load test. It lists out the scenario and test name. Then gives the Baseline value and Comparison value followed by a % change from baseline. There is also a color scale added to help you quickly identify problems.
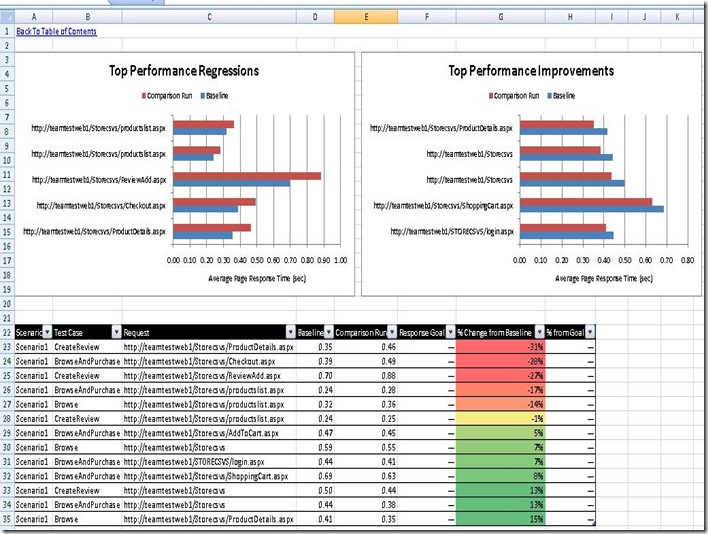
5) Page Comparison – This is very similar to the test sheet, but gives a breakdown of each page. The other difference is that it includes the response goal value and gives you a % change from goal. So if you set page goals, they would appear here.
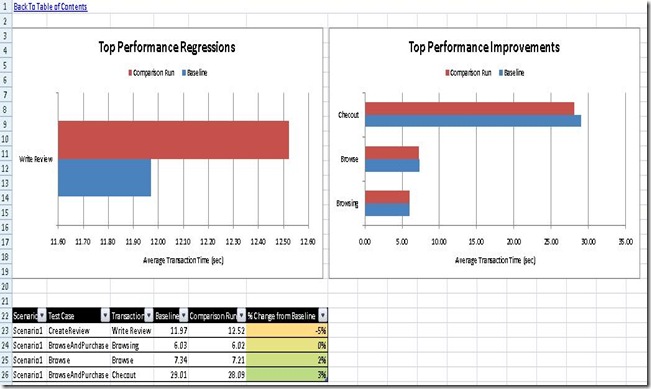
6) Transaction Comparison – Again, this is similar to test and page sheets.
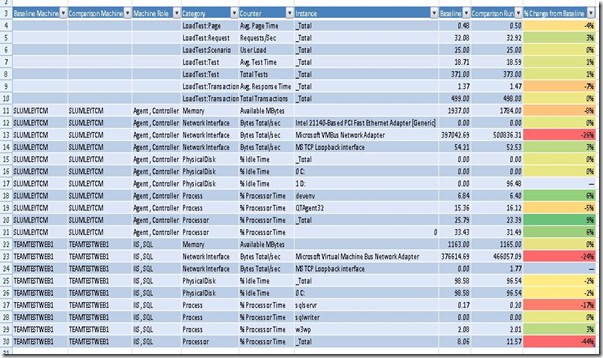
7) Machine Comparison – This page will compare counters between the two runs. As you can see from the screen shot below, it lists the Machines used in the Baseline and Comparison runs as well as the roles for the machine. The role is important because in order for two machines to be compared the roles need to match. For example, if MachineA was the IIS server in Baseline and was SQL Server in Comparison run, then the report will not compare that machine between the 2 runs. You will still have the counters for that machine listed, but it will not line them up for a comparison. Now if MachineA was the IIS server in Baseline run and MachineB was IIS role for comparison run, those 2 machines will be compared. This is useful if you will be doing many runs, but are not guaranteed the same set of machines for every run you do. As you can see from my report, TeamTestWeb1 played the role of IIS and SQL Server for both of my runs which is why they were compared.
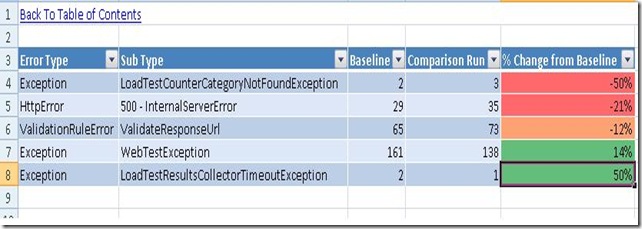
8) Error Comparison – This page give you a breakdown of errors in each run and % change between the runs.
As mentioned in the previous blog on excel reporting, the report definition that you generate is saved in the load test database. So you can come back later and generate the report again, or use that as a template to generate other run comparison reports.
I hope you find this report useful and let us know what you think.
Comments
Anonymous
January 11, 2010
Is there a way to automate this process? It would be good to have this feature automatically run after nightly Loadtestrun and automatically compared with previous build or previous public release build and generate the report excel file. Thanks a lot.Anonymous
February 10, 2013
Try Visual studio load test docx report generator addin visualstudiogallery.msdn.microsoft.com/52539996-c6cc-44fd-a90a-1f835d135d46


