Tool to generate DebugDiag rule for SharePoint based on event id (Tag) and optionally a partial message
When I updated my post on how to create DebugDiag rule based on event id (Tag), I received some feedback that modifying the scripts is quite error prone and more often than not the resulting script would not work as expected. To that end, I decided to create a visual tool that will create the rule template based on the parameters that matter. This rule template can be imported directly into DebugDiag. Please use DebugDiag 2 Update 2 (or later) which you can download from Microsoft. So let’s see two different scenarios.
Download the tool here: Tool Binaries
Unzip the files to your tool folders.
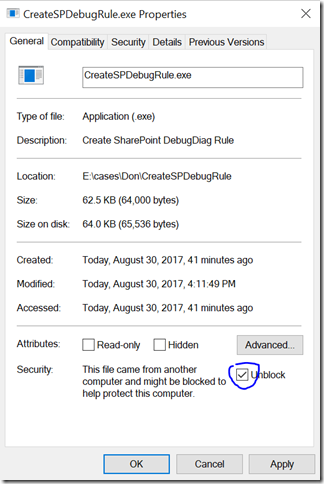
NOTE: Normally when you download an EXE (zipped or not) from the Internet, Windows will block the execution. To resolve this, right click on CreateSPDebugRule.exe and check ‘Unblock’ and click OK:
When the ULS log entry points to w3wp.exe
We plan to generate a dump file based on this fresh ULS entry:
08/30/2017 14:48:18.80 w3wp.exe (0x3820) 0x2714 SharePoint Foundation DistributedCache air4a Monitorable Token Cache: Failed to get token from distributed cache for '0).w|s-1-5-21-3258600628-1467426315-3527673178-500'.(This is expected during the process warm up or if data cache Initialization is getting done by some other thread). aa74149e-4d3f-b0b8-39ea-4e89c1505cc6
IMPORTANT: The entry needs to be fresh because the process id changes when IIS resets.
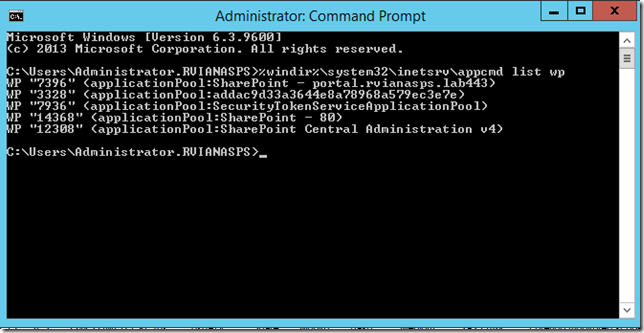
Along with the process name, ULS logs include the process id (PID) in hex format. In this case, the thread is 0x3820 which is 14368 in decimal. There is an easy way to identify the application pool via command prompt.
Run from an elevated command prompt (IT WILL NOT WORK ON POWERSHELL):
%windir%\system32\inetsrv\appcmd list wp
So we learned the application pool name is ‘SharePoint – 80’.
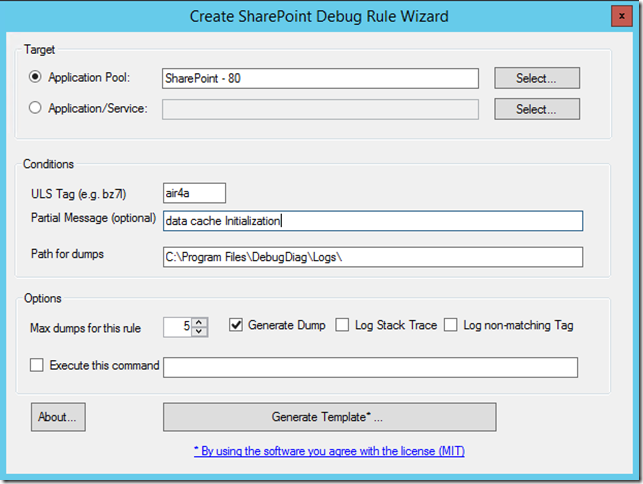
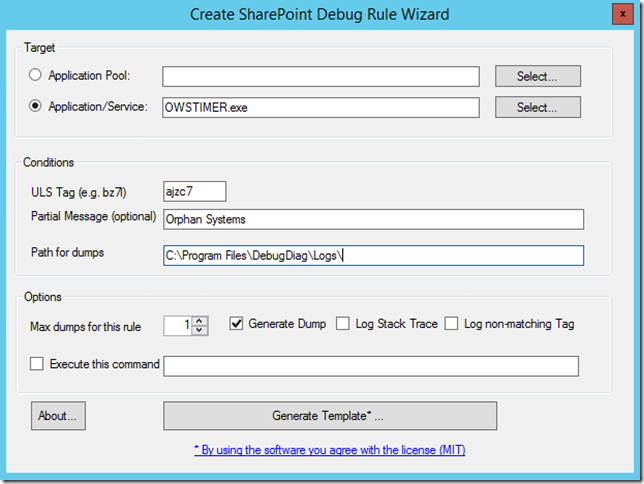
You can fill out the form as below. Notice that I add a ‘partial message’ – this is necessary when a tag is too generic and you just want to capture when the message contains some pattern. The tag bz7l which I discussed in several occasions for example is very specific, it only occurs when a claim credential cannot be converted to Windows credential, so there is no need to add a partial message. In doubt, add a partial message. I can choose the number of dump files to be created by the rule (the default is 5).
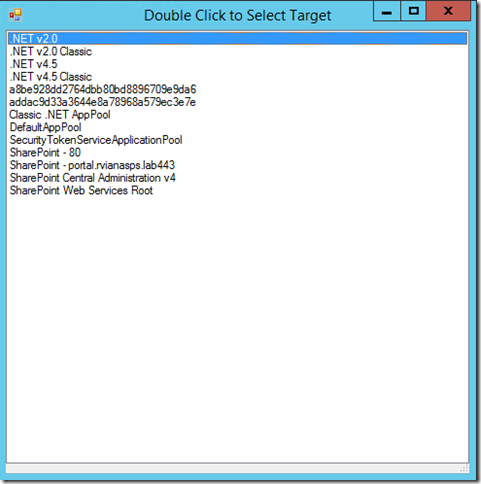
You do not need to run the tool on the server where the dump will be captured, but if you do you have the advantage of Select the Application Pool by clicking the Select… button (you need to run the tool in administration mode for this). The selection window looks like that.
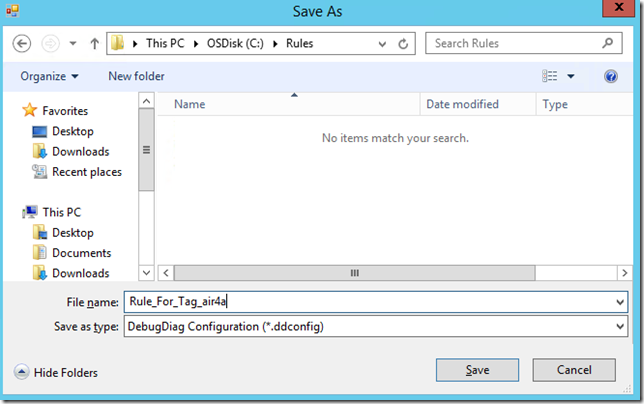
If you have everything in place you click on Generate Template… and choose a name (the name will not affect the name of the rule name in DebugDiag).
To import the rule into DebugDiag
- Run ‘DebugDiag 2 Collect’.
- Click ‘Cancel’ to close the Rule Wizard.
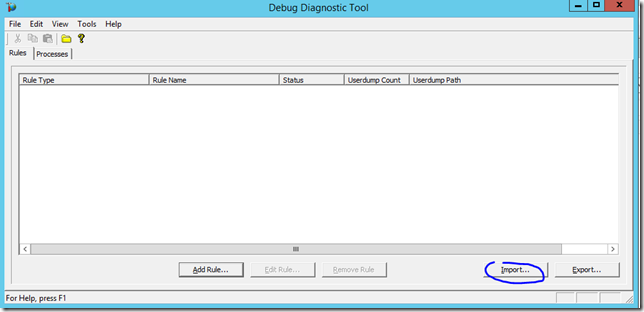
- Click the ‘Import’ button to load the rule you created with the tool
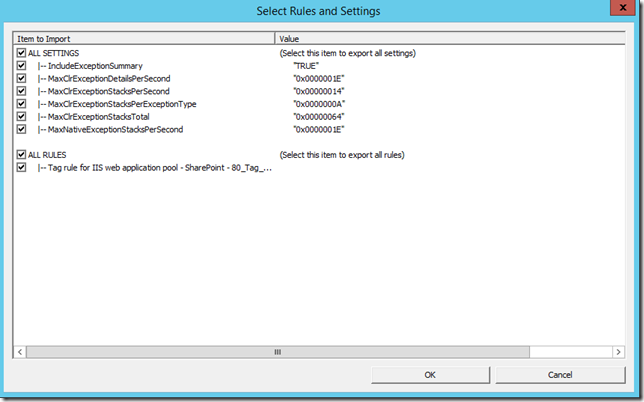
- Click Ok to accept the rule settings
- Notice that the rule will not be active when you import. You need to right-click the rule and choose Activate Rule. If this is the first time you activate a rule there will be several pop-ups from DebugDiag, just accept all defaults.
- Once the rule is active, the dump will be generated when the condition occurs.
When the ULS log entry points to a process
For this scenario,, we plan to generate a dump file based on this ULS entry:
08/30/2017 14:48:29.28 OWSTIMER.EXE (0x1A94) 0x04E4 SharePoint Server Search Administration ajzc7 Medium Cleanup of Orphan Systems in server CONTOSOWFE ac74149e-4d87-b0b8-39ea-409643feb4b7
Notice that this time, you do not need a fresh ULS log because we will capture based on a service (actually based on a process name). OWSTIMER.exe is the name for the SPTimerV4 service, The tool needs the process name which is how it shows in ULS log already. You can fill out this rule like below. Notice I chose ‘Application/Service’ this time. You can also use the Select… button to choose the process if you are running the tool on the server. This is the form filled out:
Feel free to play around and adapt the tool by changing the source code if you want to. The project zip is somewhere at: https://github.com/rodneyviana/blogdemos
Comments
- Anonymous
September 01, 2017
The PowerShell equivalent for listing the W3WP processes:& $env:windir\system32\inetsrv\appcmd.exe list wp
