Tablix – Multiple Subtotals Are Easy (aka Goodbye InScope)!
Reporting Services 2005 with Matrix
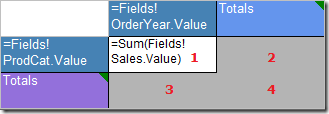
In a matrix in Reporting Services 2005, accomplishing multiple or different subtotal calculations at the same grouping level was difficult, but possible. If you wanted to accomplish custom subtotal calculations in RS 2005, you may have heard about using the InScope function to dynamically determine the scope of a matrix cell at runtime. Let’s take a closer look at the following example with red numbers highlighting four different zones of the matrix to better understand the usecase:
1: Product category sales by each year. The matrix cell is within the scope of both, the ProdCat group as well as OrderYear group.
2: Product category sales aggregated across all years. The subtotal cell is within the scope of the ProdCat group, but outside the scope of the OrderYear group because it aggregates all years.
3: All product sales per each year. The subtotal cell is outside the scope of the ProdCat group (aggregating all products), but within the scope of the OrderYear group.
4: Overall grand total. The subtotal cell is outside both grouping scopes.
By default, the calculation defined in the matrix cell (1) in RS 2005 is performed the same way (but with different grouping scopes) in the subtotal cells (2, 3, 4).
There are however situation where for example, you want to calculate a running total of all product sales for each year (i.e. subtotal cell 3), and you want the average product category sales per year (i.e. subtotal cell 2). Or perhaps you only want drillthrough links to be active on individual matrix cells, but not on the subtotals.
To accomplish this in RS 2005, you would have to define the expression in the matrix cell using the following general pattern:
=iif(InScope("RowGroup"),
iif(InScope("ColumnGroup"),
"In Matrix Cell (1)",
"In Subtotal of RowGroup (2)"),
iif(InScope("ColumnGroup"),
"In Subtotal of ColumnGroup (3)",
"In Subtotal of entire Matrix (4)"))
Replace "In Matrix Cell (1)" , "In Subtotal of RowGroup (2)" , "In Subtotal of ColumnGroup (3)" and/or "In Subtotal of entire Matrix (4)" with the expressions or fields that you want.
Reporting Services 2008 with Tablix
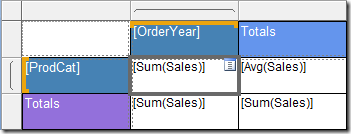
With tablix in Reporting Services 2008, this scenario is significantly easier to accomplish. First, you get explicit cell definitions for each of those aggregation areas which removes the need for complex expressions and the usage of the InScope function:
In addition, you can define as many subtotals at every tablix grouping level as you like. For example, besides Sum(Sales), you could calculate a percentage of total revenue, or even year-over-year growth as shown in the following design surface screenshot.
The example above shows three different column subtotal calculations side-by-side under each OrderYear group instance:
- Year Total
- Year-over-Year growth percentage*
- a KPI image that shows the growth trend (up/down/flat)*
Subtotals can use different styles as well as layout height or width. The example above also shows further aggregations such as the monthly trend shown as a nested sparkline chart*.
* Stay tuned - the underlying report, including RDL source, will be explained in an upcoming posting.


